Pareto Analysis in Action: Optimizing Multifamily Maintenance Operations
Italian economist Vilfredo Pareto found that 20% of Italy's population received 80% of the country's income. This became known as Pareto's principle, also known as 80/20 rule.
It was 9:50 PM on a Saturday when my phone rang.
My son had just fallen asleep after forty-five grueling minutes of rocking and humming. On the other side of the line, our on-call maintenance tech was standing in a flooded bathroom at a property where he had never worked.
The property maintenance didn’t answer, and my number was next on the list.
The toilet supply line had broken and water was spraying everywhere. He couldn’t find the shut off valve for the apartment; which it didn’t have. The water had to be cut off for the entire building.
A few minutes later, my phone rang again. This time it was to tell me there was nearly no supplies in the maintenance room, and the problem couldn’t be fixed immediately. This would leave everyone without water till the morning.
This was not an isolated event. It happened more often than I care to share.
Managing over 1,000 doors across nine different complexes, all of them 30+ years old, had become a maintenance nightmare.
When leadership asked me to analyze the maintenance process, I knew it would be a very difficult task. Pulling it off would be a miracle.
Money Pit
Recently, I came across an article about the top challenges multifamily faces. The top one was none other than maintenance. I had to concur. Even more so for aging properties.
Having worked in this industry for as long as I have, I know too well that maintenance is a money pit.
At the time, my employer, on the verge of bankruptcy, was looking to cut costs in every possible way. It was no surprise that maintenance was one of the first items they tackled.
The Impossible Task
The goal was to streamline every possible aspect, establishing clear guidelines for all fixtures the properties needed. But the biggest change of all was to make the corporate warehouse the only maintenance supplier for all the complexes.
With an almost non-existent budget, I already knew the outcome of that task without even starting.
Two weeks later, I presented my proposition to the stakeholders.
Aside from the up-front inventory costs, there was a logistics nightmare. Just as expected, by the end of the meeting, the project was scrapped.
The high maintenance costs still remained, and at some point, it would have to be addressed. It was a thorn that wouldn’t go away.
The million-dollar question: How do you improve maintenance without making crippling cuts?
The answer is simple: Use the Pareto Analysis.
What is the Pareto Analysis?
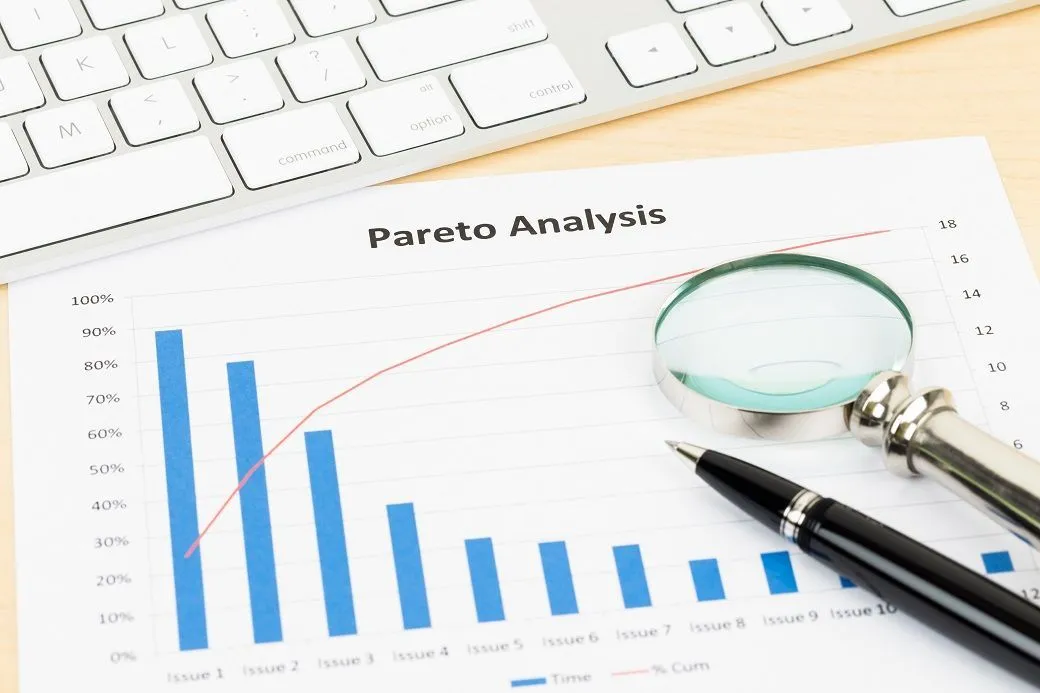
Italian economist Vilfredo Pareto found that 20% of Italy’s population received 80% of the country’s income. This became known as Pareto’s principle, also known as 80/20 rule.
This is a very interesting phenomenon that we can see all over the place and in many different settings.
For instance, 80% of the complaints come from 20% of the services you offer. Or 80% of revenue comes from 20% of the products you sell.
If this principle is used strategically, you can solve many issues. It was by applying this method that I discovered that 20% of the maintenance issues accounted for 80% of the costs.
Before I jump ahead of myself, let me start from the beginning.
The Ground Work
Supplier invoices were collecting dust in the file cabinet. The property managers submitted the invoices, and the accounting team paid. Pretty simple.
My groundwork involved collecting data to find the 20%. I could have started with the maintenance tickets, but I decided the data there was too unreliable. More to come on that.
Dusting the file jackets, I pulled an entire year’s worth of supplier invoices. Line by line, product by product, invoice by invoice. I went through every single information from all of the suppliers.
The results were presented to my manager. His reaction was exactly what I thought. His jaw hit the desk.
Dealing with Suppliers
Suppliers were charging whatever they wanted. One property had undergone some remodeling and had to replace four bathtubs. All four were the same style, brand, and SKU numbers. All prices were different.
Another maintenance supplier was charging different prices to every property for the same items.
Using the lowest price found in the invoices, I calculated the amount of savings we would have if we were always charged the lowest price for the entire year. It was well over $30k across all properties.
I called every supplier and raised hell. We demanded refunds and a better approach to our nine accounts; otherwise, we would be moving our business elsewhere.
What they didn’t know was that just about every supplier had taken advantage of us one way or another. And if we were to leave all of them, we would have no suppliers.
This data revealed a lot more than just the obvious. Analyzing what properties had been purchased, I was able to apply the 80/20 again and come up with another 20% driving 80% of the cost.
Standardizing Big Ticket Items
The number one cost was HVAC. When maintenance needed to replace one, they would call the supplier and ask for a system. I noticed that some properties worked with one specific brand, while others were inconsistent with multiple brands.
I later found out it was up to the maintenance technician, and some only wanted to work with Carrier or Goodman.
Aside from HVAC, the other items that consistently came up were water heaters, appliances (stove and fridge), ceiling fans, kitchen faucets, bathtub valves, and tools.
Solution
I began a long process of negotiations with multiple suppliers. When all was said and done, I selected one supplier.
During the negotiations, I created an extensive list of supplies that our properties used and established a limited list of supplies they could purchase. Instead of receiving the huge catalogs, now they would only get a two-page list.
This avoided the purchase of tools and supplies outside the scope of maintenance requirements.
Side note, I got some serious hate emails when the list was rolled out. Maintenance technicians wanted answers to why they could no longer order Carrier systems. Or buy their tools on the company’s tab.
Maintenance Tickets Data
In the process of collecting data, I learned about the human reporting bias.
The process for submitting a maintenance request was nearly identical in all properties. The resident called in or came by the office with their request. The manager entered the information into the system, printed the ticket, and slid it into a to-do box.
At some point, maintenance completed the task and documented their actions in the paper, then slid it into the done box.
In the final step, the office staff marked it as complete (with no further notes in the system) and discarded the paper.
There was no record of the parts used, the actions taken, or how long it took to resolve the issue. Managers would often take days to mark tickets as completed, even after the work was finished.
There was something else that I had not even begun to explore. The maintenance requests that never made it into the system.
The ones where residents would catch maintenance technicians out and about and request them to handle something simple. If the task met an unspoken requirement, technicians would complete it, and they would go unreported.
At that point, the ticket data became more qualitative and, for our purposes, insufficient for analysis. Hence my decision to use vendor’s invoices.
Other Solutions
Aside from applying the Pareto Analysis to lower the cost of maintenance, I also suggested other things. Unfortunately, those were outside of my control, and enforcement depended on property managers.
Maintenance Dashboard
That experience taught me a valuable lesson. When you are managing multiple doors across many different geographical locations, it can be very challenging.
Today, with technological advances, collecting and analyzing this type of data is relatively easy. Maintenance technicians use their cell phones to update their own tickets.
Building on my previous experiences, I designed a maintenance dashboard to help keep track of things that could be easily missed.
What once took hours of manual digging through invoices and handwritten tickets can now be seen at a glance. The dashboard visualizes everything that once hid in file cabinets and inboxes— the vendors charging too much, the units eating up your budget, and the patterns repeating across properties.
With one screen, you can see:
Which properties are consuming the most maintenance dollars
What categories are driving those costs (HVAC, plumbing, appliances, etc.)
The ratio of preventive vs. reactive repairs
Average work order completion time
Supplier pricing variances
And, most importantly, which 20% of issues are still driving 80% of your costs
No more guesswork. No more being caught off guard at 9:50 PM on a Saturday.
The same principles I used years ago with dusty invoices now live inside a dynamic system that updates automatically— turning maintenance from a reactive expense into a predictive strategy.
Because maintenance doesn’t have to be a money pit. With data on your side, it becomes a roadmap to profitability.
Final Thoughts
You don’t have to be a data analyst or a data scientist to find your 80/20 anymore. What once took hours of spreadsheets and highlighters now lives in one place — clear, visual, and actionable. The dashboard connects the dots for you, showing exactly where your time and money are going, so you can spend less time digging through data and more time fixing what actually matters.
No comments yet. Be the first.