Maintenance Dashboard
Poor maintenance management drains profits across portfolios every day. This dashboard will help you keep track of all your maintenance tickets and how long they are taking to be done.
Getting Started
1️⃣ Connect Your PMS → Import current work orders and costs.
2️⃣ Upload History → 12–24 months for model training.
3️⃣ Set Targets → Cost reduction, downtime, SLA improvement.
4️⃣ Configure Rules → Preventive cycles and alert thresholds.
5️⃣ Review Recommendations → Top vendors, risky assets, cost outliers.
6️⃣ Track Results → Watch NOI rise as inefficiencies vanish.
Identify properties, units, or vendors driving excess maintenance costs. See which work orders consistently go over budget and where inefficiencies hide.
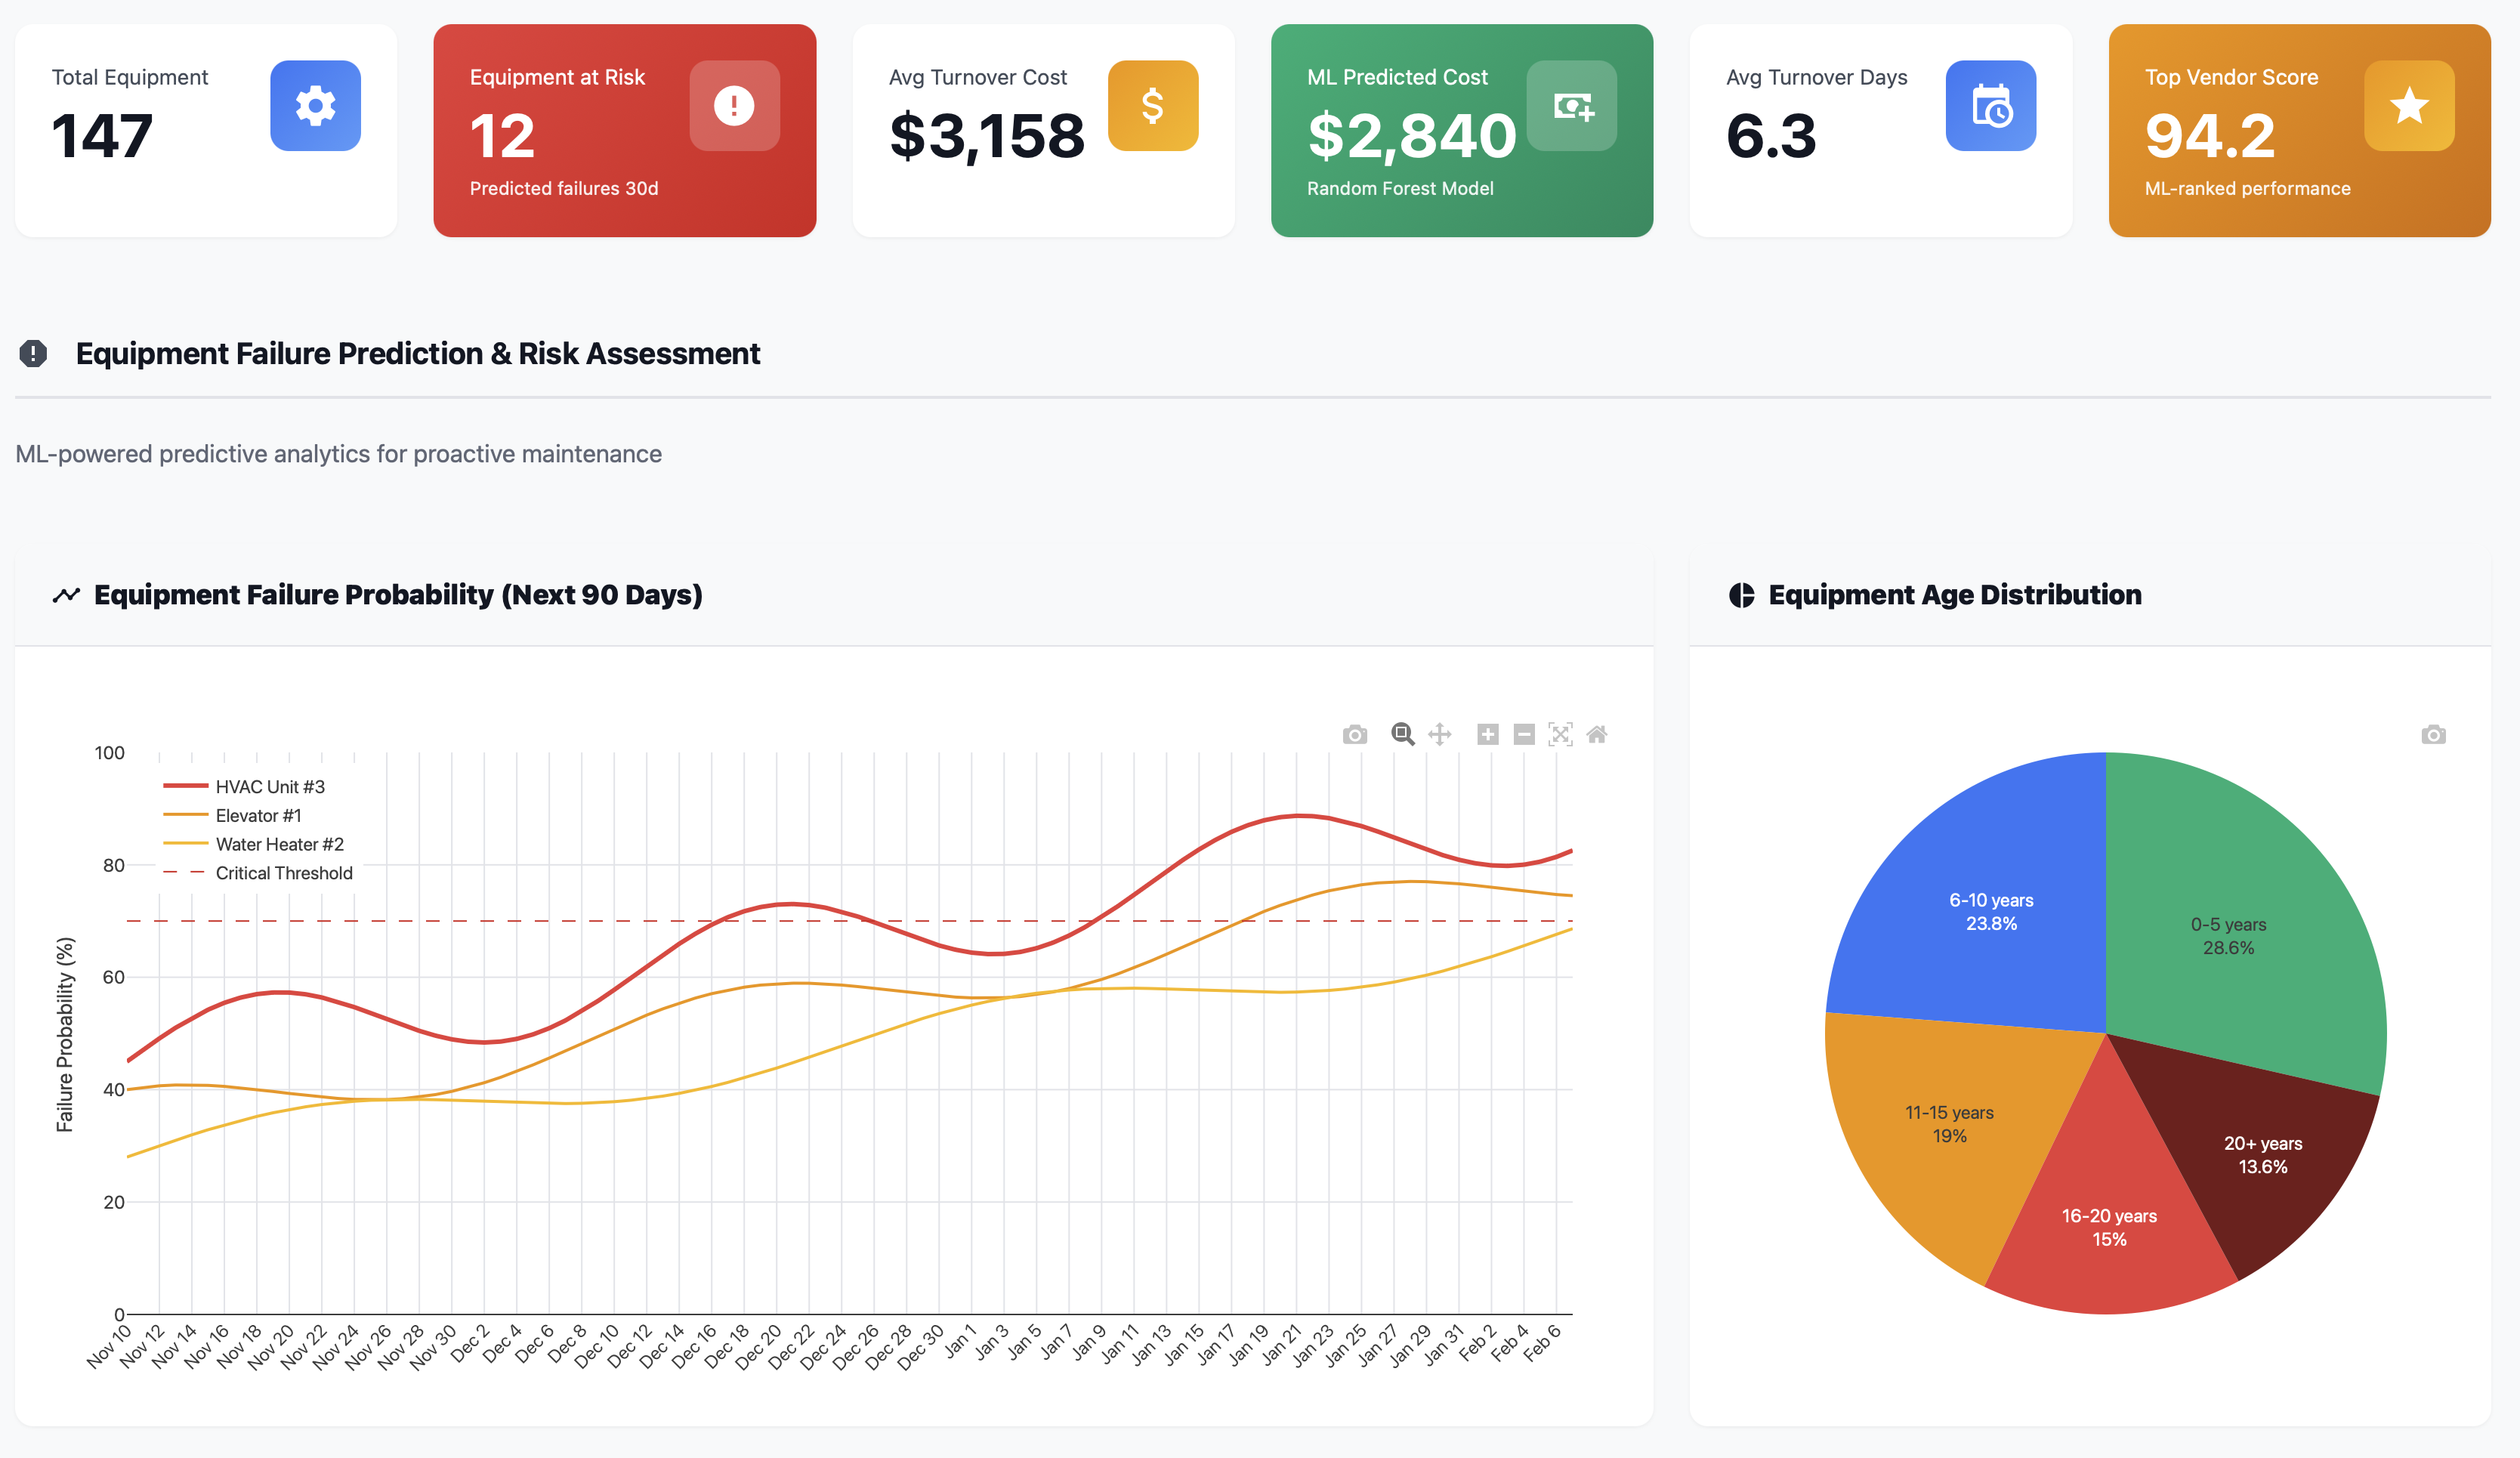
Use predictive analytics to flag assets likely to fail in the next 30–60 days. Prevent emergency repairs and reduce downtime with proactive maintenance.
Track work order completion time, cost per order, and technician efficiency. Identify your best-performing teams—and where to improve.
The Maintenance Problem Costing You NOI
Poor maintenance management drains profits across portfolios every day.
Common issues include:
Reactive culture: Work orders only after something breaks → emergency premiums
Vendor inefficiency: Delays and overcharges hidden in monthly invoices
No cost visibility: You don’t know your average cost per work order
Repeat issues: Same unit, same problem, multiple tickets
No predictive maintenance: Failures surprise you at the worst time
Work order backlog: Tenants frustrated, staff overwhelmed
💸 Estimated waste: 10–20% of annual maintenance spend — \(250K–\)500K for a 500-unit portfolio.
From Reactive to Predictive Maintenance
Track and compare maintenance KPIs across every property.
Property |
Avg Cost |
Completion Time |
|---|---|---|
A |
$185 |
1.8 days |
B |
$265 |
4.2 days ⚠️ |
C |
$149 |
1.1 days ✅ |
Identify assets at risk of failure before they break.
HVAC units (7+ yrs, 3+ repairs) → 65% failure risk
Plumbing with >2 leaks/6mo → 72% recurrence
Unit 214 flagged for inspection
Avg work order cost: $245
Completion time: 4.1 days
Emergency repairs: 310/year
Cost: $195 (–20%)
Completion: 2.3 days (–44%)
Emergencies: 175/year (–44%)
Simulate and Save
Scenario |
Annual Cost |
Savings |
|---|---|---|
Current Baseline |
$2.5M |
— |
Proactive (–20% emergencies) |
$2.05M |
–18% |
Predictive (AI-driven) |
$1.92M |
–23% |
Features That Transform Maintenance Strategy
Track cost, time, materials, and recurrence per order. Identify patterns to eliminate waste.
Forecast failures before they occur. Move from reactive → proactive → predictive maintenance.
Compare completion time, SLA compliance, and cost per job to reward top performers.
Analyze spend by property, system, and vendor. Identify outliers instantly.
Automate recurring tasks (HVAC, plumbing, inspections) and stay ahead of breakdowns.
Track downtime by asset type—HVAC, elevators, plumbing—and minimize resident disruption.
Who Benefits Most
Reduce work order clutter, streamline scheduling, and track property health in real time.
Gain portfolio-wide visibility, identify systemic inefficiencies, and boost technician output.
Link maintenance spend directly to NOI performance. Optimize capital preservation.
Real-World Results
A 500-unit portfolio spent $2.47M/year on maintenance with no vendor tracking.
Reactive repairs made up 38% of work orders.
Completion times averaged 4+ days.
After 12 months of optimization:
✅ Avg work order cost ↓ 20%
✅ Completion time ↓ 44%
✅ Emergency repairs ↓ 44%
✅ Preventive maintenance ↑ 163%
✅ Annual savings: \(490K**
✅ NOI gain: **\)440K/year
“We used to fix things after tenants called.
Now we fix them before they break.”
— Maintenance Director, 500-Unit Portfolio
Your Maintenance Command Center
Seamless Integration with Your Stack
Frequently Asked Questions
Q: Is predictive maintenance expensive to implement? No. It uses your existing PMS data—no new hardware needed. ROI appears within 3–6 months.
Q: How are asset failures predicted? By analyzing historical repairs, asset age, and environmental factors to generate risk scores.
Q: Can I track technician performance? Yes—completion time, cost, and first-time fix rate for each team or vendor.
Q: Does it handle in-house and vendor work? Absolutely. Both can be tracked and benchmarked side-by-side.
Q: Can I automate preventive schedules? Yes, schedule HVAC, plumbing, or appliance inspections and get pre-due alerts.
Related Topics
Ready to Get Started?
Schedule a personalized demo to see this dashboard in action.
Schedule Demo Contact Sales