Why Your Property Needs a Dashboard
The multifamily industry is heavy on reporting. None of the most common software packages provides the reports that most owners or managers require. That's why I've created Catalyzer. It is a dashboard that not only provides robust real-time reporting but also has machine learning algorithms for enhanced forecasting.
Recently, when I visited a property, the manager told me she ran the entire complex, 116 apartments, solely in Excel spreadsheets. That is ledger, maintenance requests, lease renewals, occupancy rates, tracked delinquencies. I wonder how can you ran a business like this.
Curious, I asked, “How long does it take you to prepare a report?” I asked.
“About four hours,” she admitted. “And that’s if nothing breaks in the formulas.”
This is not an isolated event. This is the reality for most multifamily operators. They’re managing millions of dollars in assets with tools designed for individual homeowners. The data exists—it’s trapped in property management systems, scattered across CSV exports, and buried in monthly reports.
What’s missing is a unified view that turns all this information into decisions.
That’s why I built Catalyzer.
The Problem: Data Silos in Property Management
If you’ve worked in multifamily, you know the drill. You have data in Yardi or RealPage. You export it monthly. Someone (usually an analyst or operations manager) manually consolidates it. By the time leadership sees the numbers, they’re already two weeks old.
Here’s what this costs you:
Time: Hours spent on manual data consolidation instead of strategic thinking.
Accuracy: Human error in spreadsheets leads to bad decisions. A misplaced formula can make a property look profitable when it’s actually bleeding cash.
Opportunity: By the time you spot a trend—rising delinquencies, falling occupancy, or maintenance issues—you’ve already lost revenue.
The multifamily industry generates incredible amounts of data. We’re just terrible at using it.
The Solution: Purpose-Built for Multifamily Operations
Catalyzer is a multi-tenant analytics platform designed specifically for property management companies. Instead of generic BI tools that require weeks of customization, it’s built around how multifamily actually works—properties, units, leases, tenants, and the metrics that matter.
Here’s what makes it different:
1. Multi-Tenant Architecture
Your data is isolated, but the infrastructure is shared. This means:
Each portfolio gets its own secure environment
Branding customization for white-label deployments
Role-based access control (executives see everything, property managers see only their properties)
OAuth integration with your existing identity provider
I’ve worked with enough property management companies to know that data security isn’t negotiable. Catalyzer uses a high security level with OAuth.
2. Property-Level Restrictions
Not everyone needs to see everything. A property manager at “Sunset Apartments” shouldn’t access data for “Oak Ridge Apartments.”
Catalyzer handles this automatically:
Configure user access at the property level
Regional managers see their region
Property managers see only their buildings
Executives see the full portfolio
No more accidentally sending the wrong report to the wrong person. The system knows who should see what.
3. Real-Time Occupancy Analytics
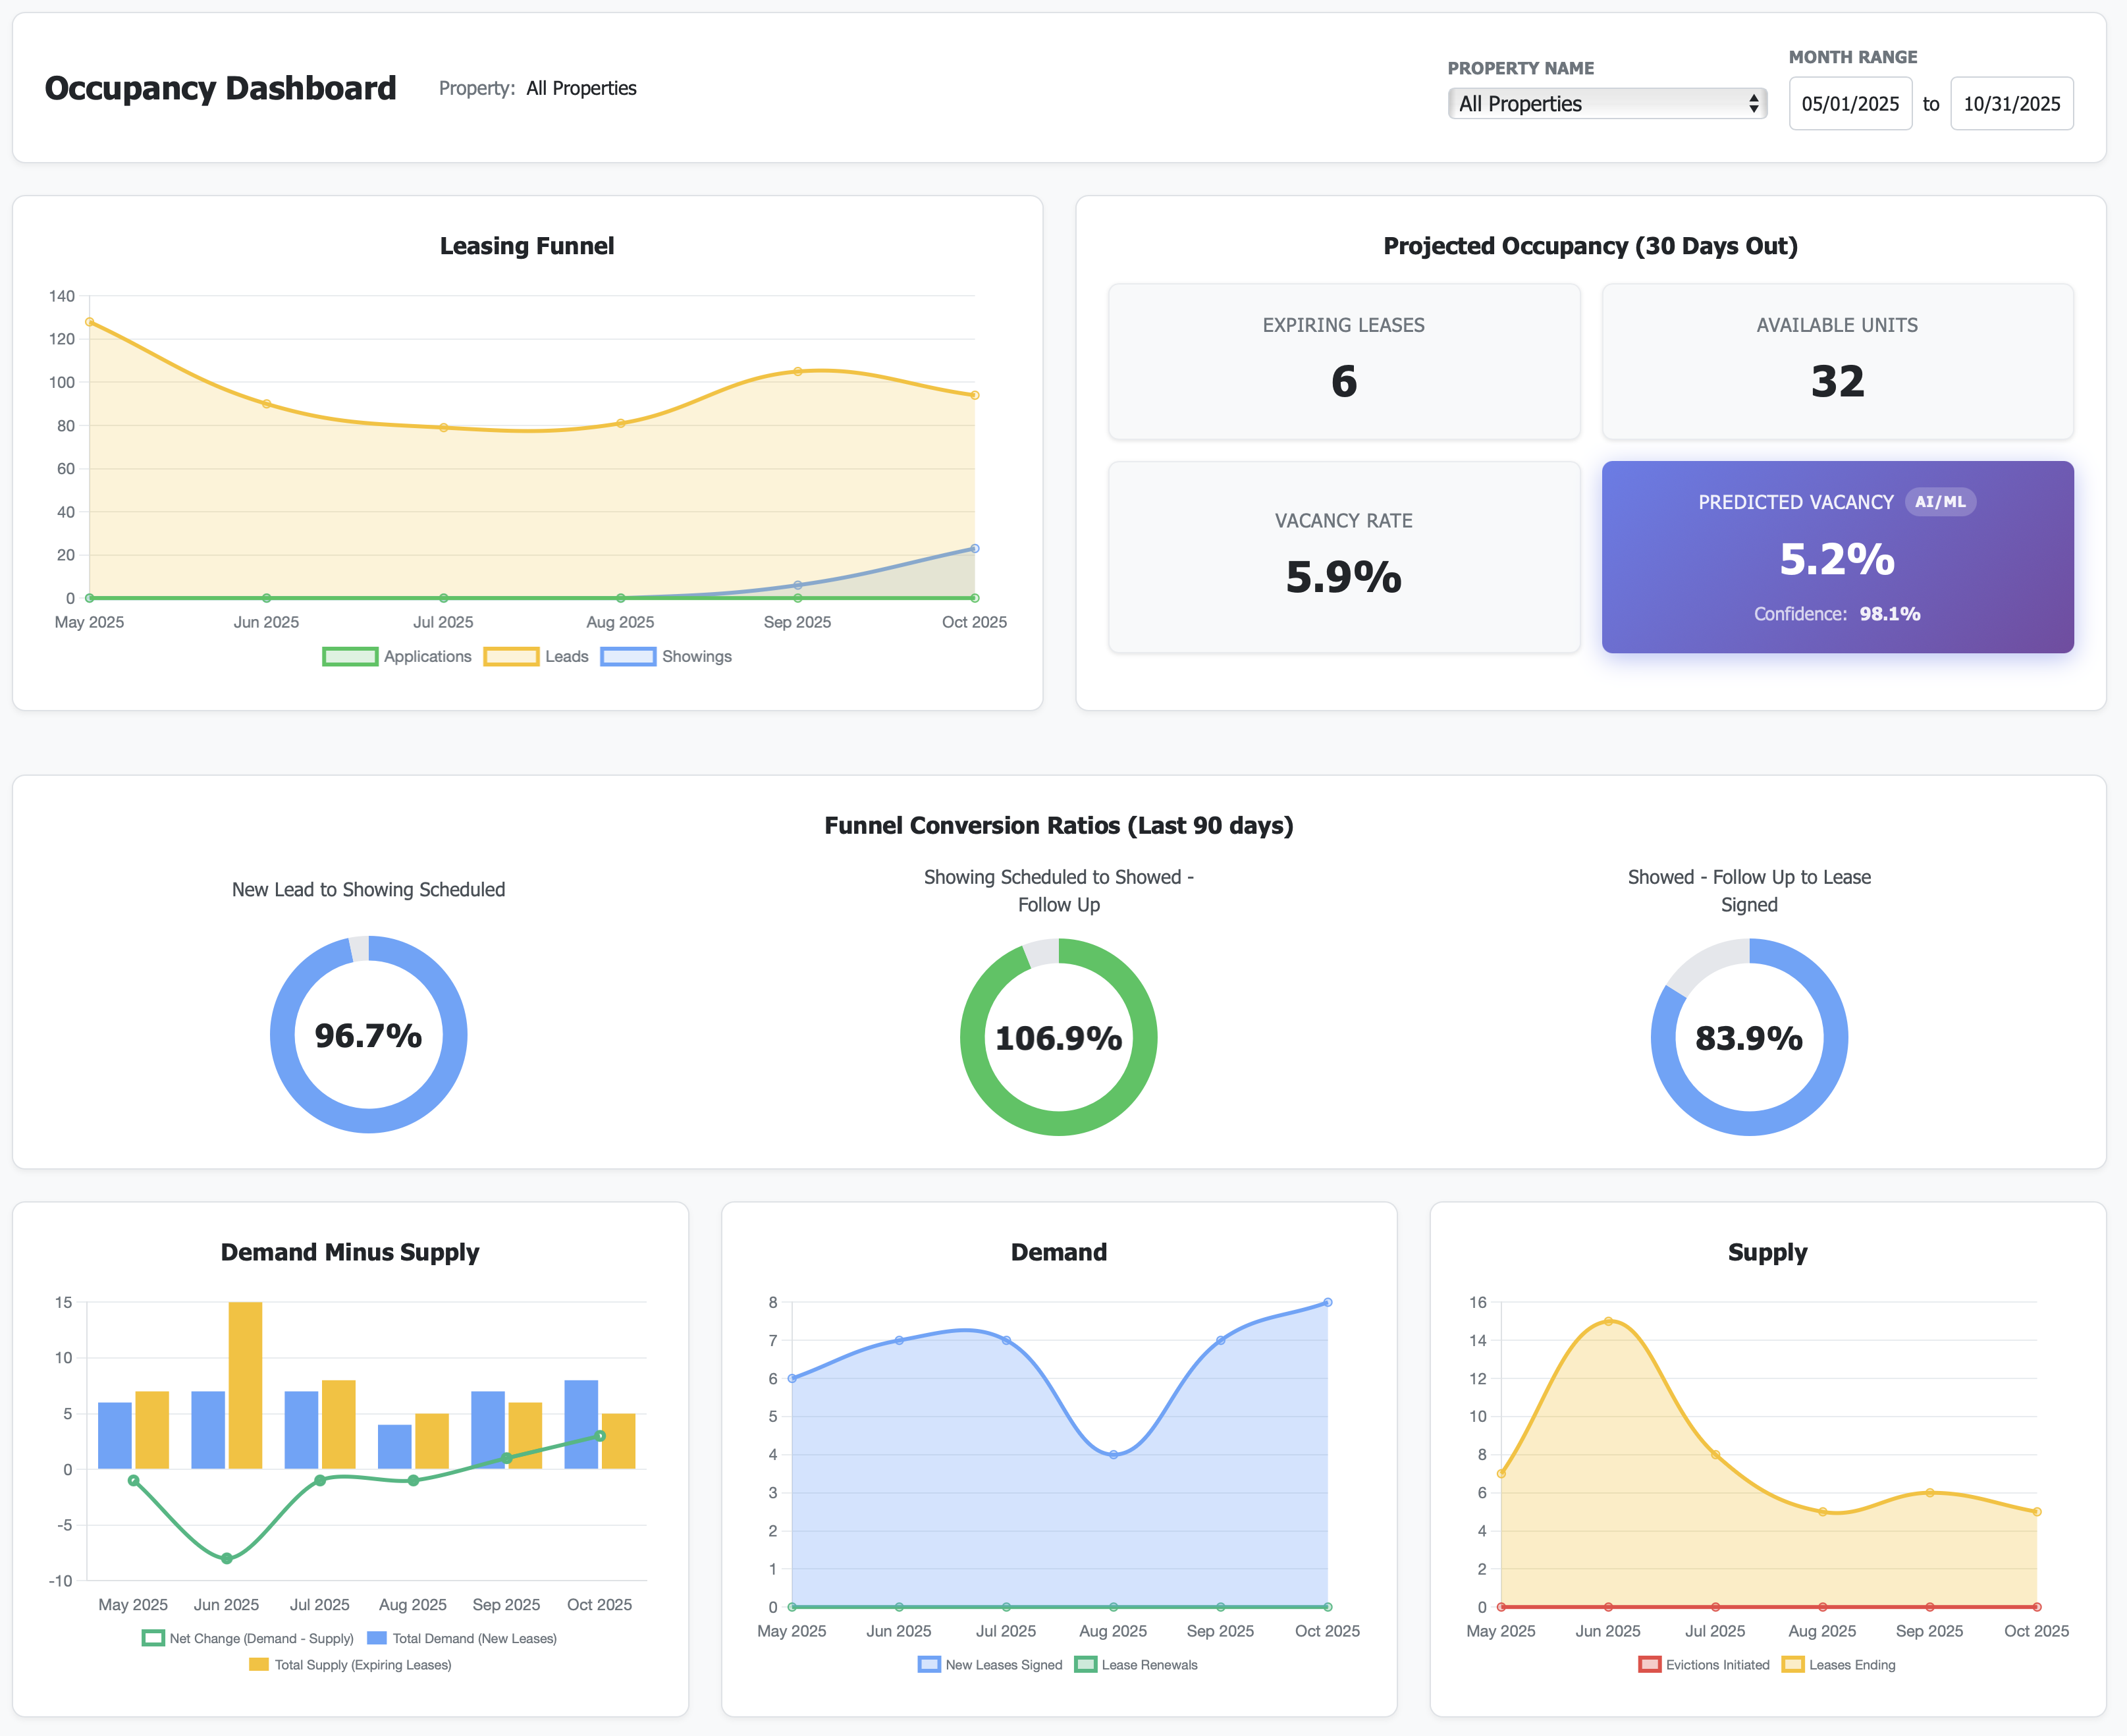
Stop calculating occupancy rates in Excel. Catalyzer gives you:
Current occupancy by property, unit type, and time period
Projected occupancy based on lease expirations and renewals
Move-in and move-out trends
Vacancy duration analysis
I learned this the hard way: occupancy isn’t just “units rented divided by total units.” It’s about understanding why units are vacant, how long they stay vacant, and what you can do about it. The dashboard surfaces these insights automatically.
4. AI-Powered Delinquency Analysis\
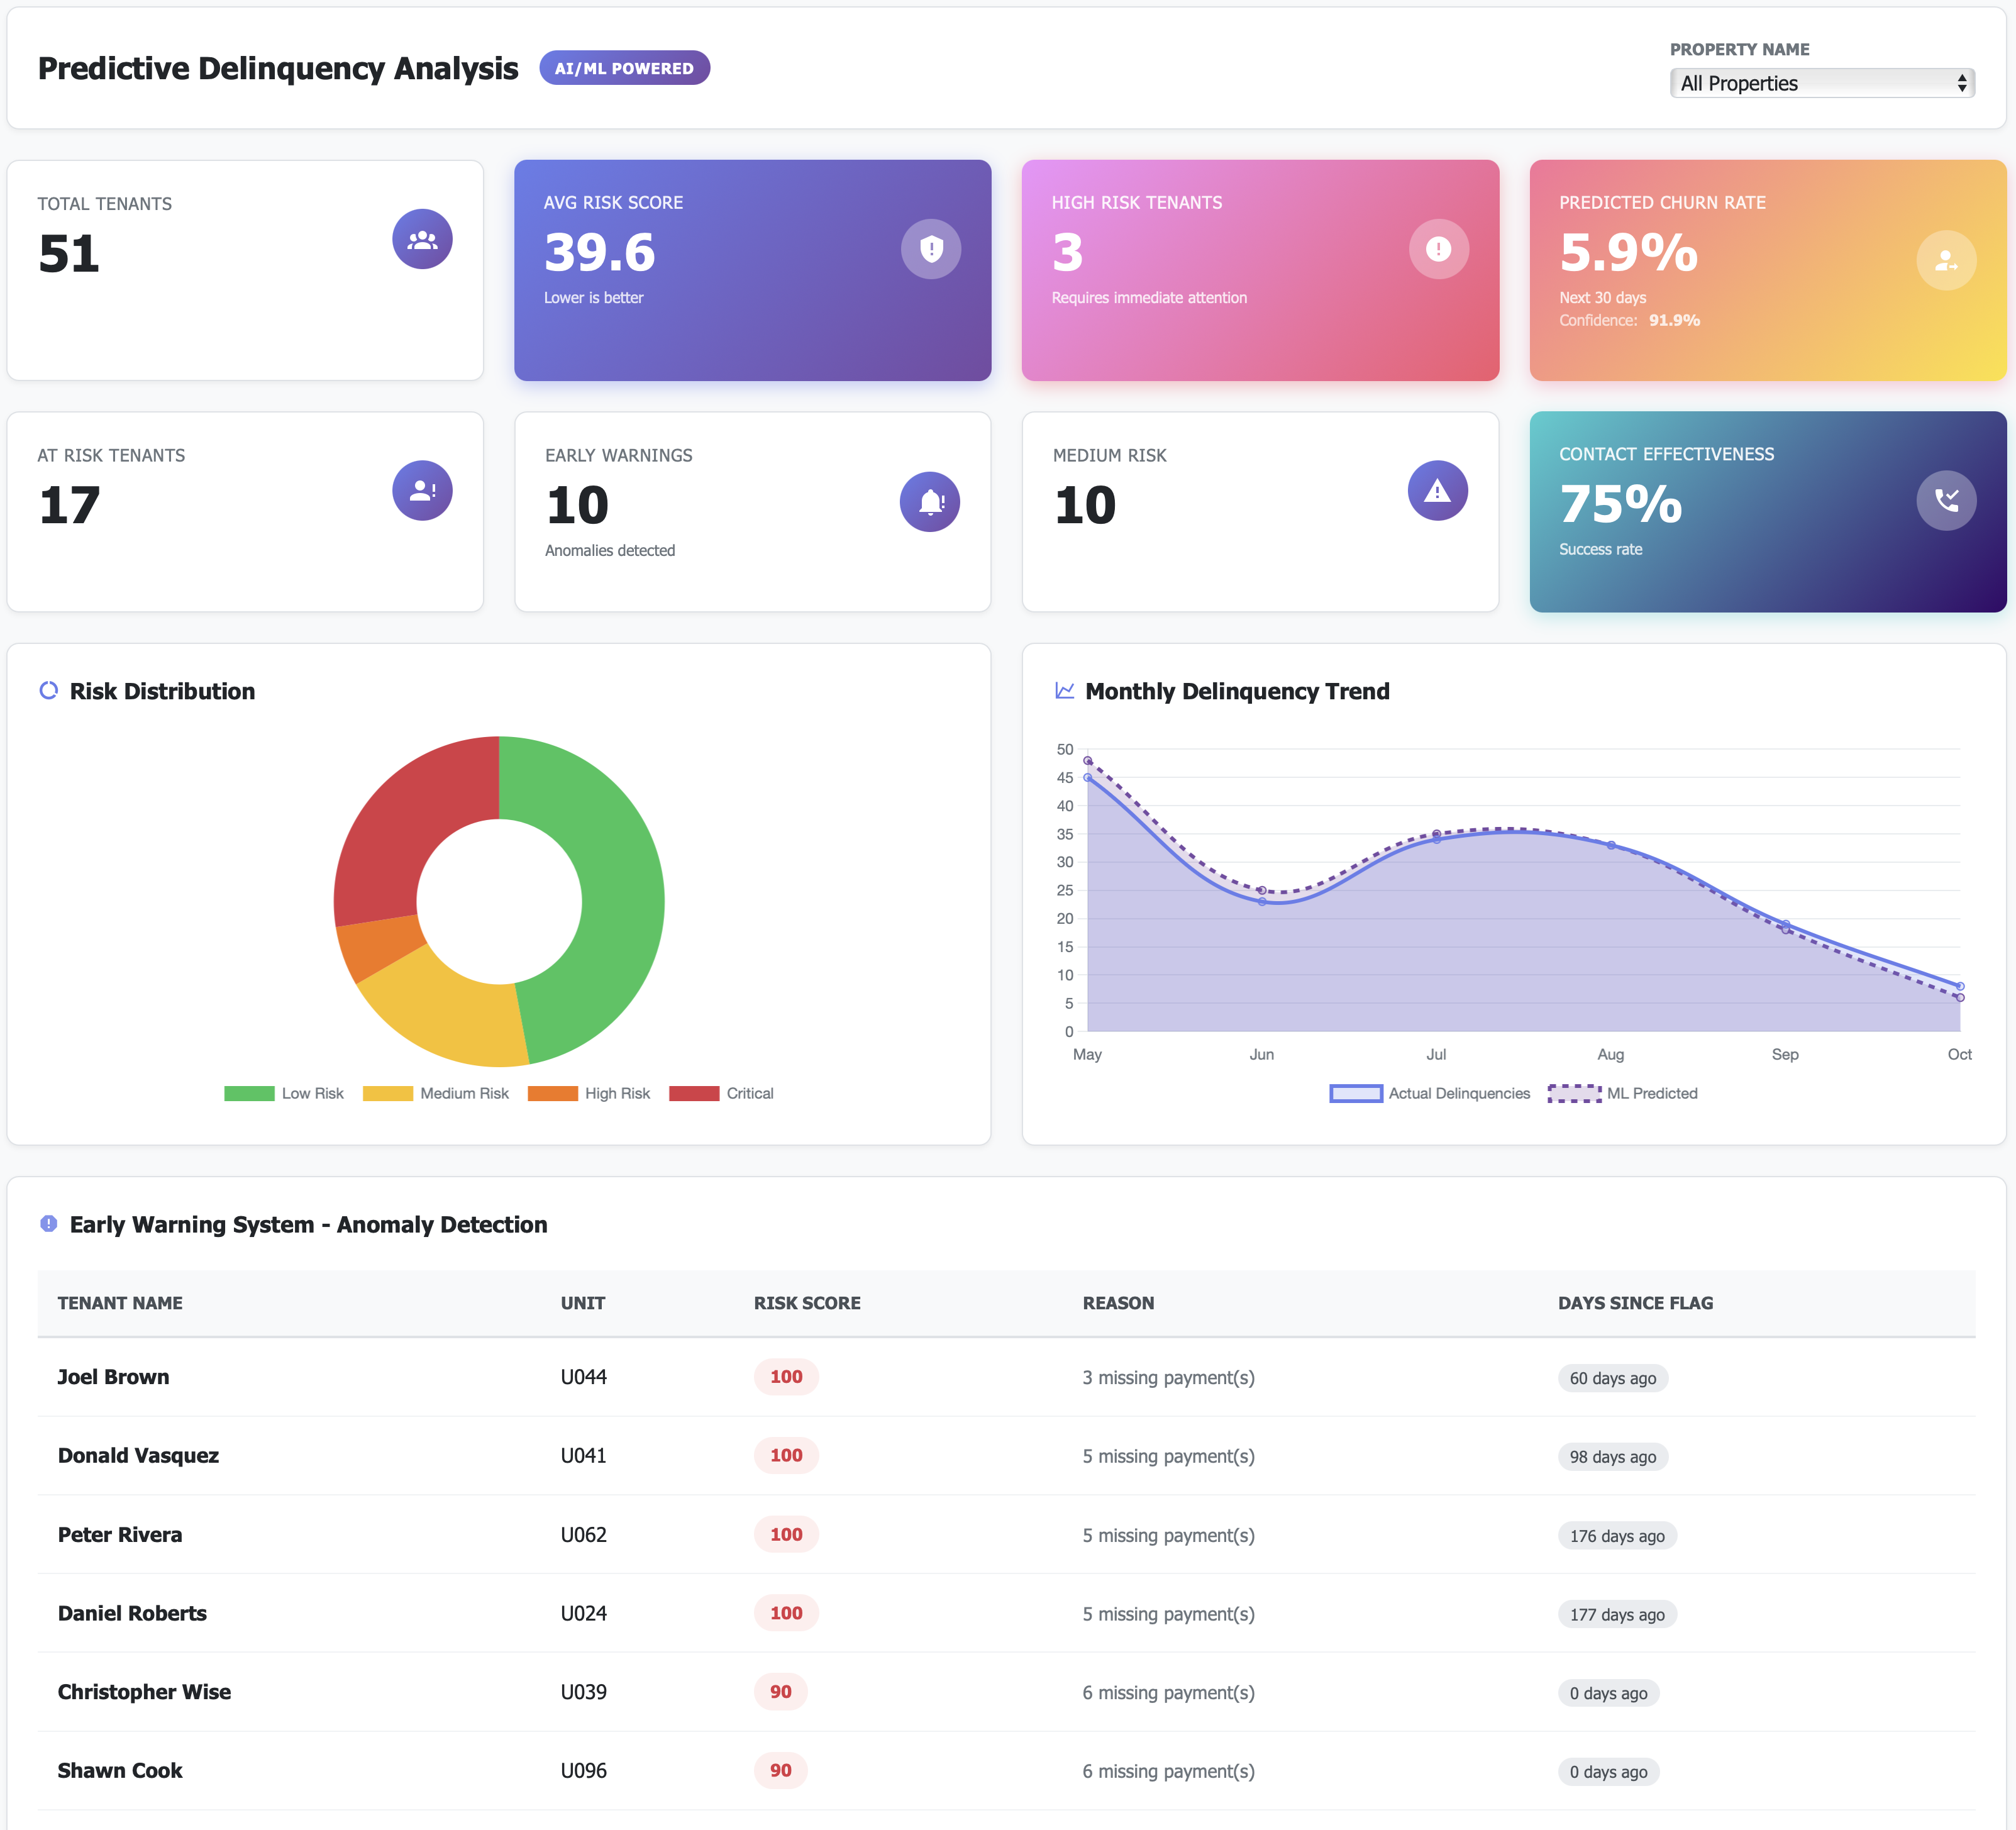
Delinquency is one of those metrics that looks simple but isn’t. A 5% delinquency rate might be fine in one market and catastrophic in another. Context matters.
The delinquency dashboard provides:
Aging analysis (30, 60, 90+ days past due)
Trend detection (is it getting worse or better?)
Property-level comparisons
Actionable alerts when patterns emerge
The goal isn’t just to show you the numbers—it’s to help you intervene before a late payment becomes an eviction.
5. Rent Optimization Insights
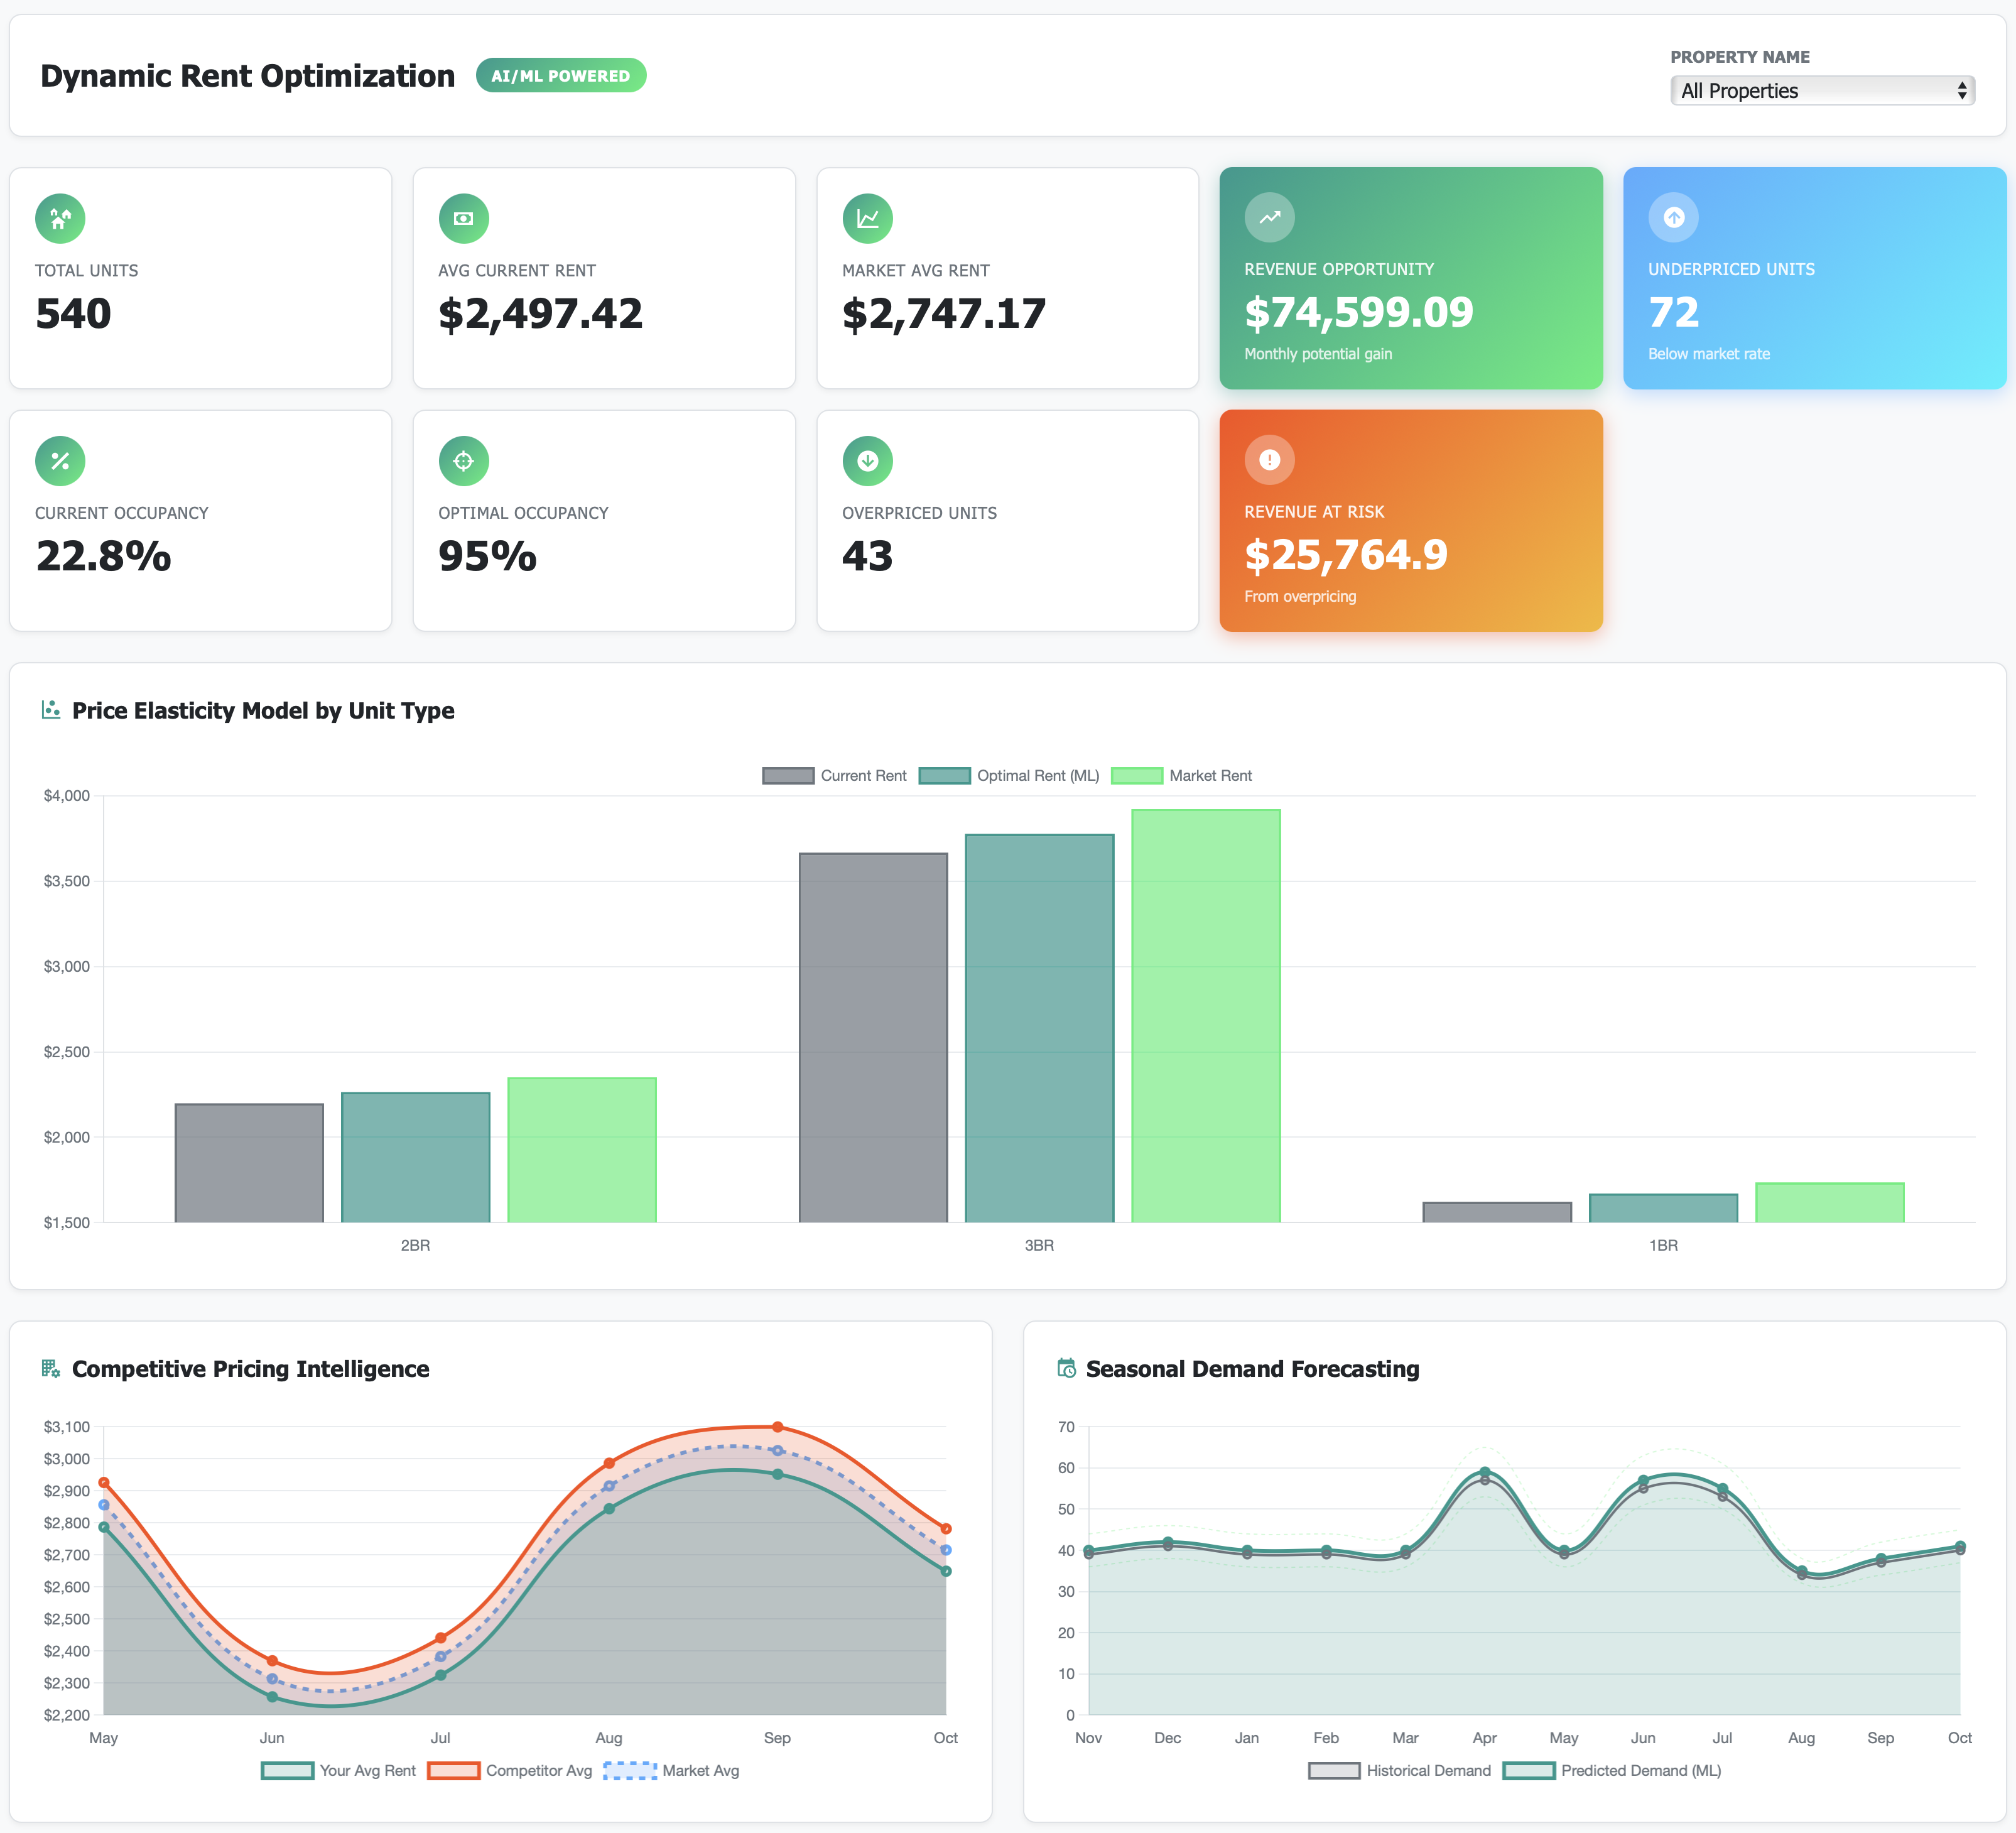
Pricing is part art, part science. Most operators rely on “gut feel” mixed with outdated comps. Catalyzer brings data to the decision:
Market rent vs. actual rent by unit type
Rent growth trends over time
Concession impact analysis
Renewal vs. new lease pricing
I tend to be decisive when I have the right information. This dashboard gives you that information so you can stop guessing and start optimizing.
6. Pre-Lease Forecasting
You don’t want to be surprised by a sudden vacancy spike. The pre-lease dashboard shows:
Upcoming lease expirations
Renewal probability (based on historical patterns)
Projected turnover costs
Pre-leasing performance
Think of it as looking six months into the future. You can’t predict everything, but you can prepare for what’s likely.
7. Predictive Maintenance
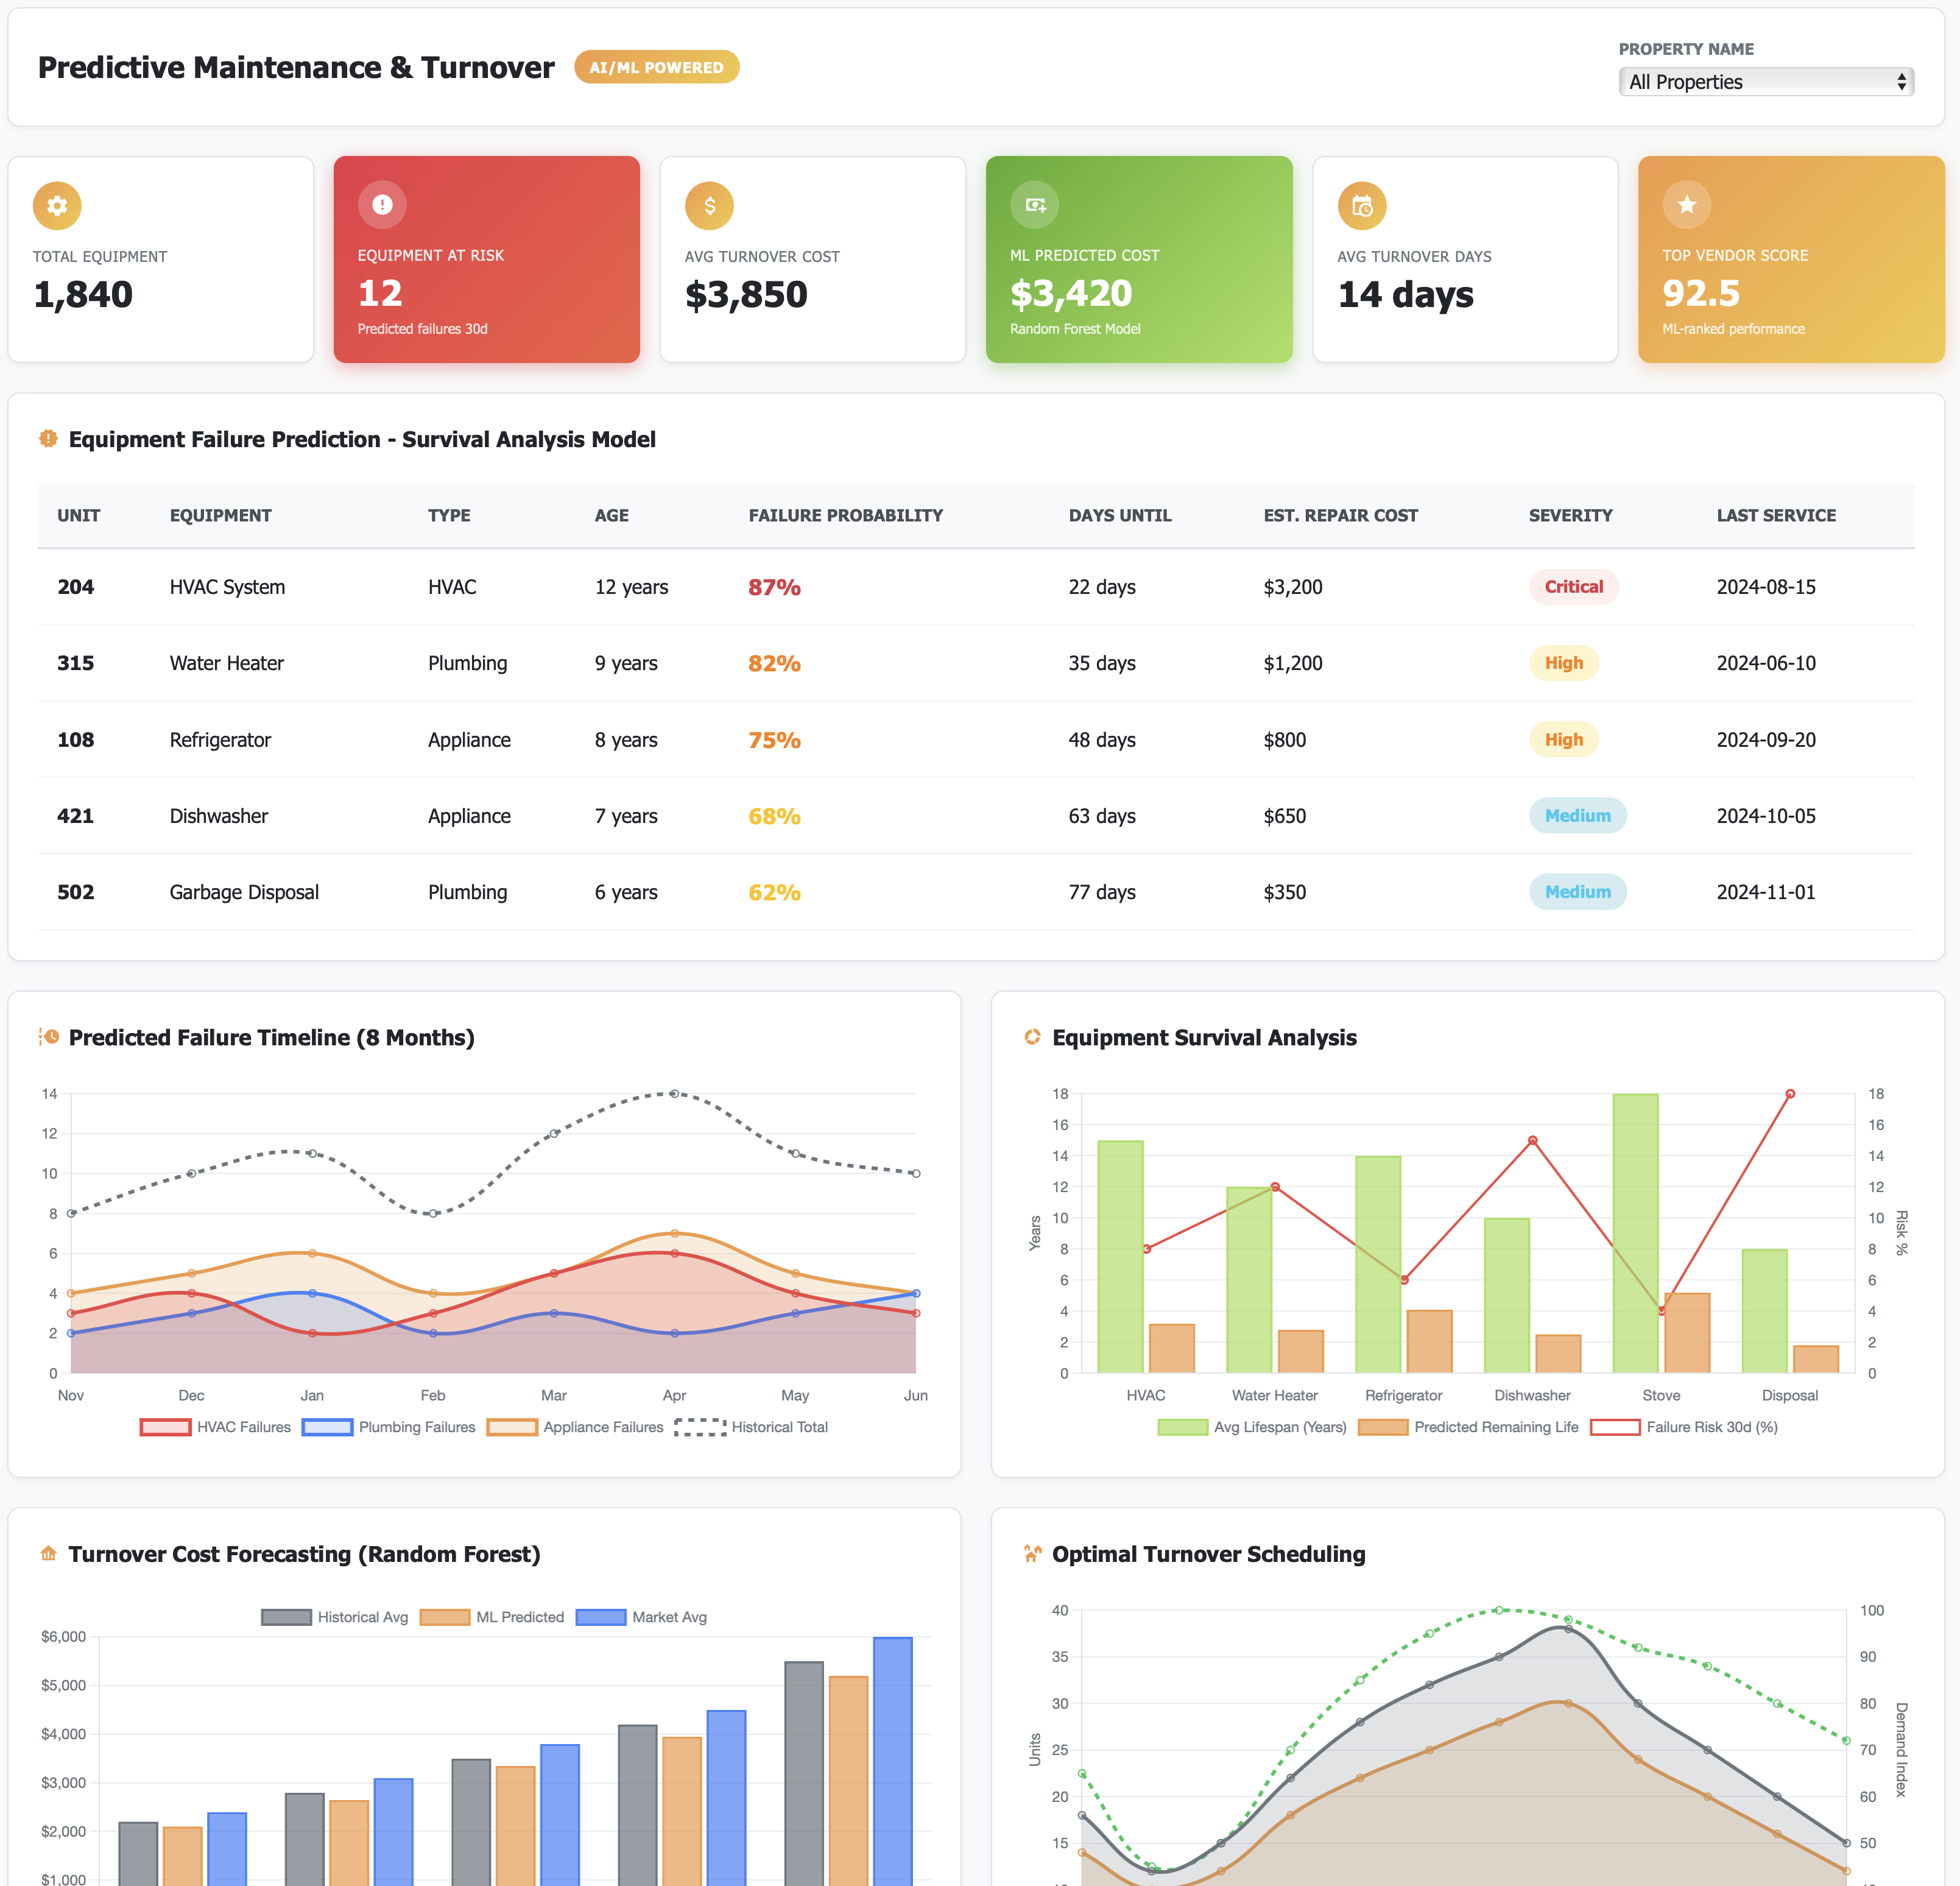
Maintenance requests aren’t random. Some properties have recurring issues—HVAC failures in summer, plumbing problems in winter. The predictive maintenance module:
Identifies maintenance patterns
Flags properties with higher-than-average work orders
Forecasts maintenance spend based on historical data
Prioritizes preventive vs. reactive repairs
This is where analytics moves from “nice to have” to “directly impacts the bottom line.” Catching an HVAC issue before it fails saves you emergency repair costs and prevents tenant complaints.
8. Leasing Performance AI
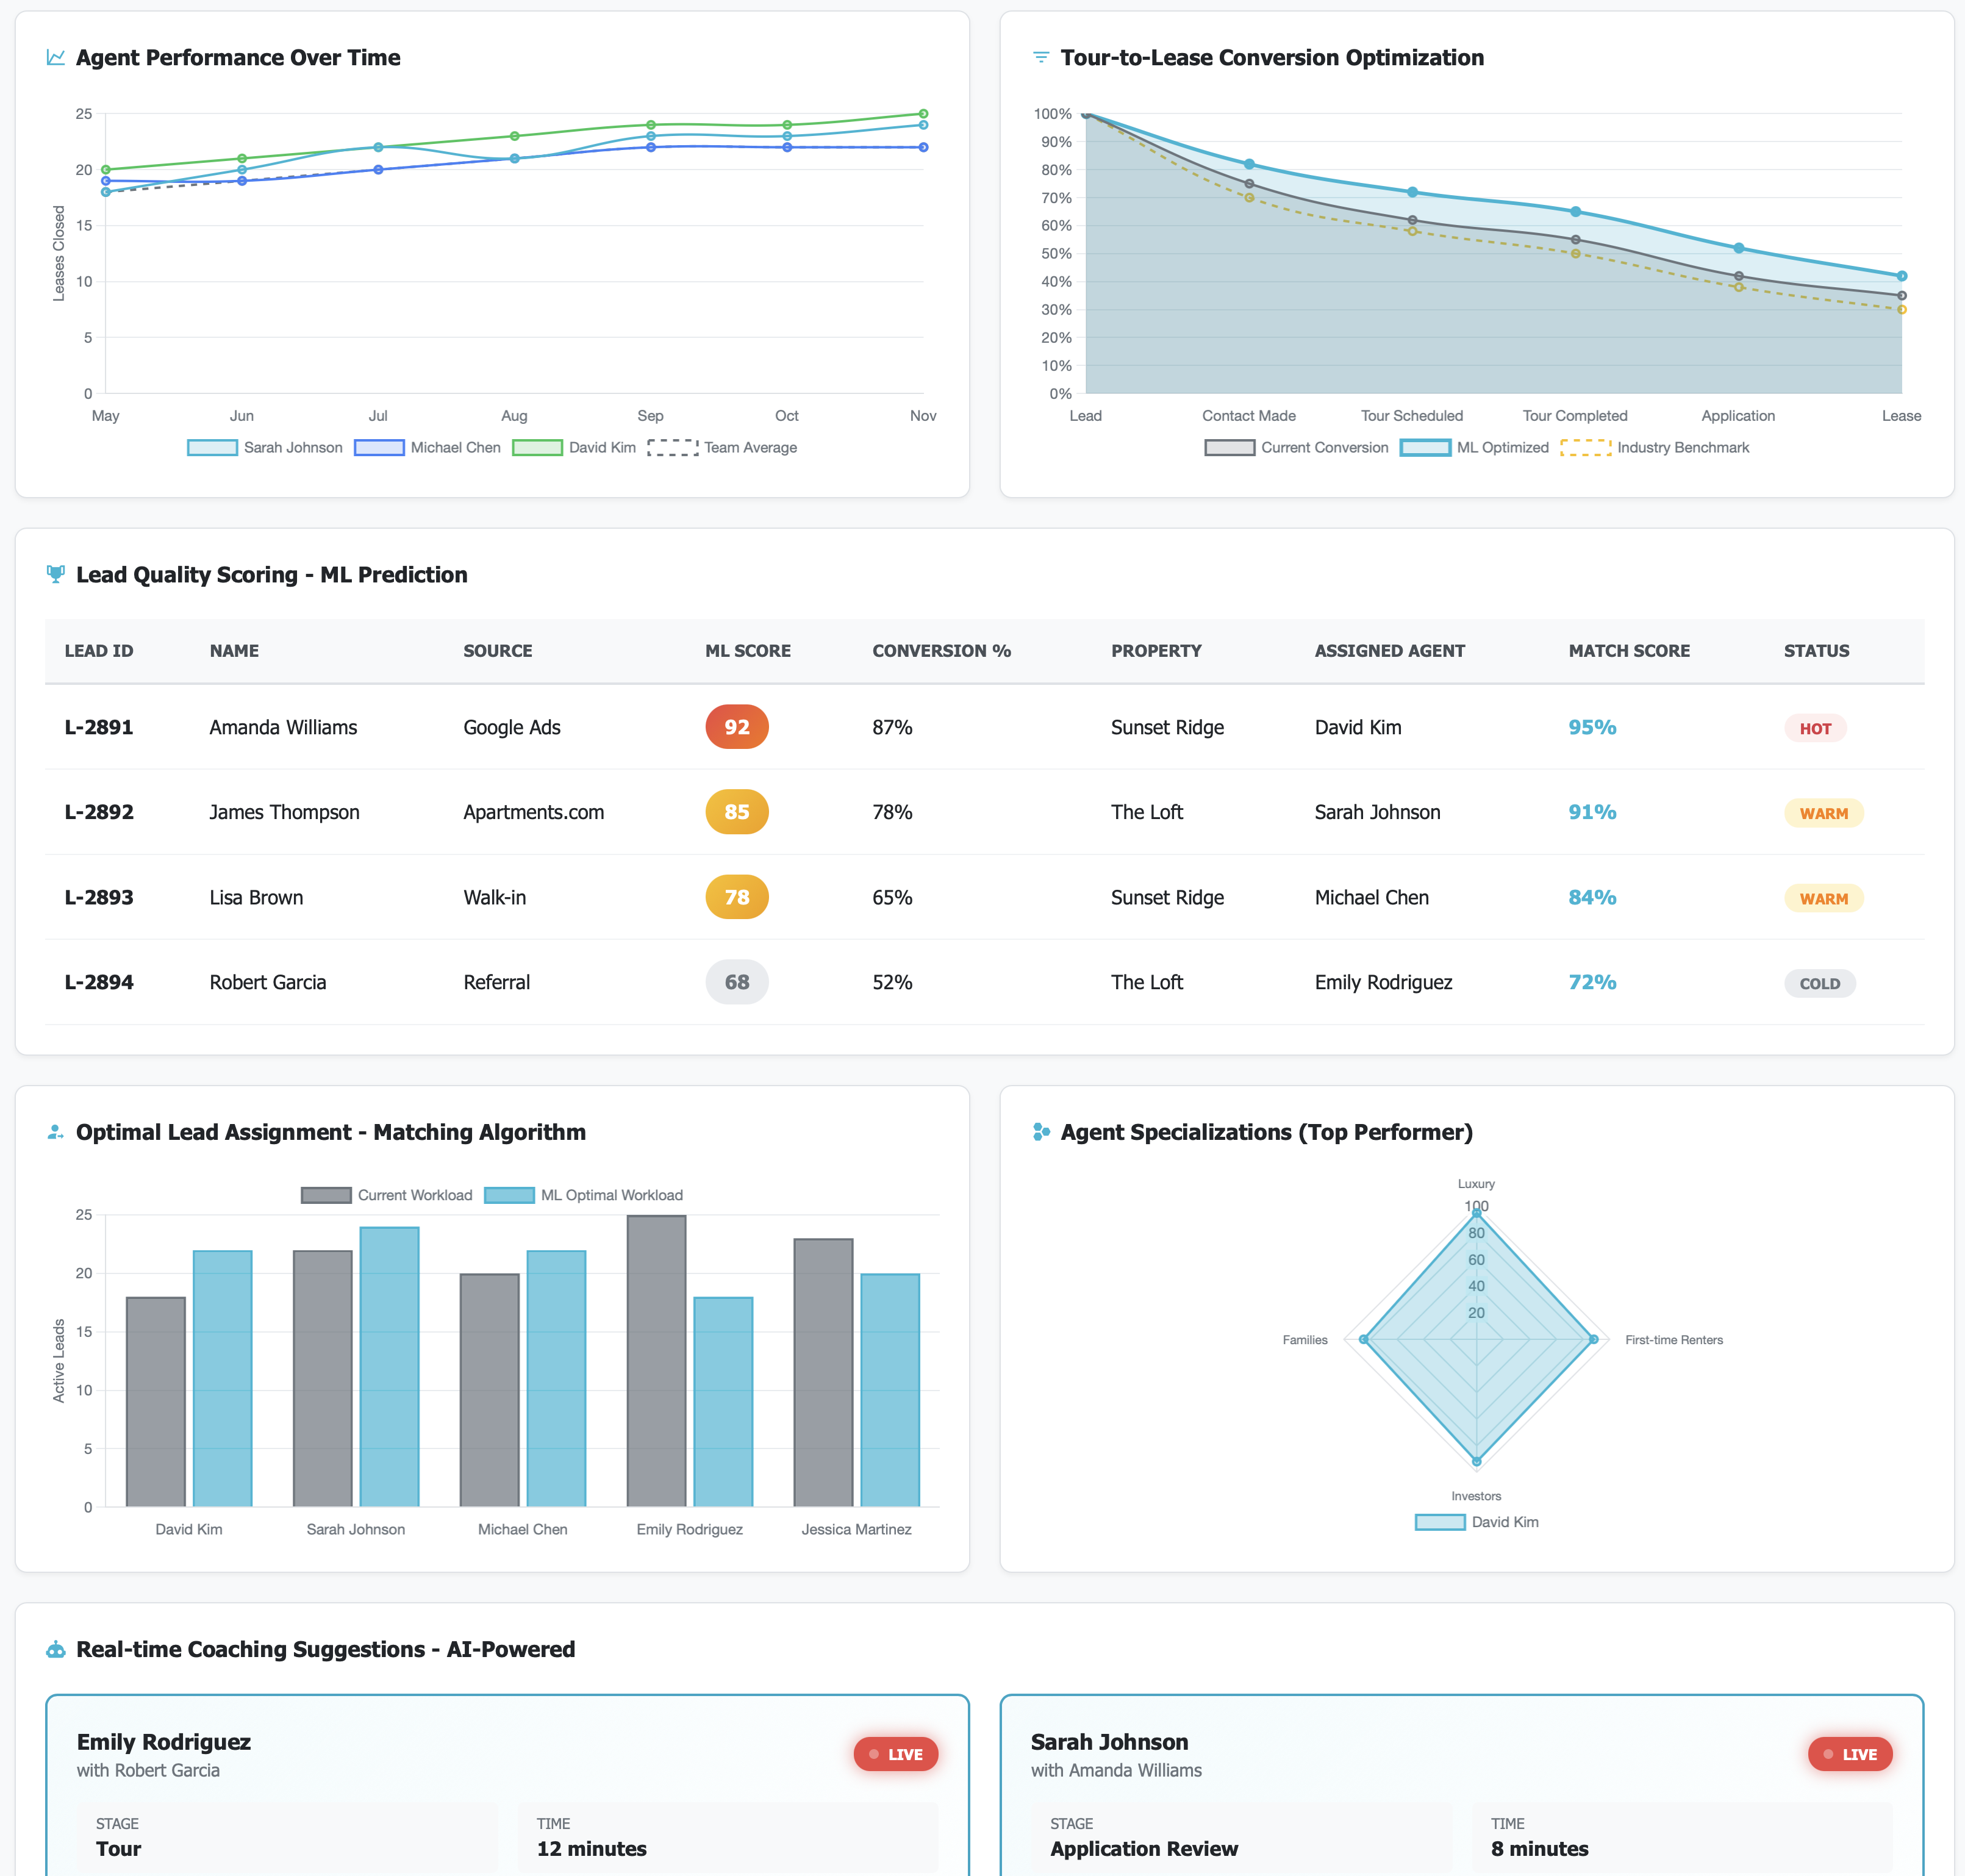
How good are your leasing teams? Not subjectively—objectively. This dashboard tracks:
Days to lease (from listing to signed lease)
Conversion rates (tours to applications to leases)
Agent performance by property
Seasonal trends in leasing velocity
If you manage 10+ properties, you probably have leasing teams with wildly different performance levels. This lets you identify what works and replicate it.
How It Actually Works
I’m a data scientist. I like simple architectures that work. Here’s what Catalyzer is built on:
Backend: Python/Flask with PostgreSQL for data storage.
Frontend: Responsive dashboards that work on desktop, tablet, and mobile. Because property managers check numbers on their phones at 10 PM.
Authentication: OAuth 2.0 integration (Auth0, Okta, etc.) so you’re not managing another set of passwords.
The technical stack matters less than this: it’s fast, reliable, and designed to scale from 5 properties to 500.
Who This Is For
Catalyzer is built for:
Property Management Companies managing 1 or 10+ properties who are tired of manual reporting.
Regional Managers who need real-time updates without calling every property manager for updates.
Executives who want strategic insights, not spreadsheets.
Analysts who spend too much time cleaning data and not enough time finding insights.
The Value Proposition
Let me be direct: this saves time and makes money.
Time saved: What takes 4 hours in Excel takes 4 minutes in Catalyzer. Multiply that across weekly reports, monthly board meetings, and quarterly reviews. You’re buying back hundreds of hours annually.
Better decisions: You can’t optimize what you don’t measure. Rent optimization alone can increase NOI by 2-3% across a portfolio. On a \(10M revenue portfolio, that's \)200K-$300K annually.
Reduced risk: Early detection of delinquency trends or maintenance issues prevents costly problems. One avoided eviction or prevented HVAC failure pays for the platform multiple times over.
Competitive advantage: While your competitors are still consolidating spreadsheets, you’re making data-driven decisions in real-time.
What’s Next
If you’re interested in seeing how this could work for your portfolio, let’s talk. I’m offering early access to property management companies who want to be part of shaping the next version.
It is your time to make a move! Contact me today for a demo!
No comments yet. Be the first.