The Silent Profit Killer: How Utilities Drain Multifamily NOI
As a vendor in the multifamily industry, I was constantly visiting properties, talking to managers, maintenance technicians, and occasionally, owners.
As a vendor in the multifamily industry, I was constantly visiting properties, talking to managers, maintenance technicians, and occasionally, owners.
One afternoon, I received a call to visit a property. Familiar with the area and all the apartment complexes, I knew that the property was built in the 70s, which was good for my business—lots of work.
As I pulled in, one of the owners was standing outside the office patiently waiting for me. After a long conversation, he expressed his concerns over the profitability of his property.
This was his first multifamily property, and he was still learning the ropes.
“The first two years, we were profitable.” He explained, “But our profit margins have been declining, and we are on track to break even this year.”
My first assumption was to look at the usual suspects—rent, delinquency, vacancy, and maintenance costs.
We walked into his office to try to figure out the problem.
Before I move on, a side note here. I’ve been in hundreds of apartment offices, and they all share one thing in common: the smell. Over the years, I’ve identified three distinct smells, regardless of where I went or what state I was in. This one was smell #1: old coffee and paper.
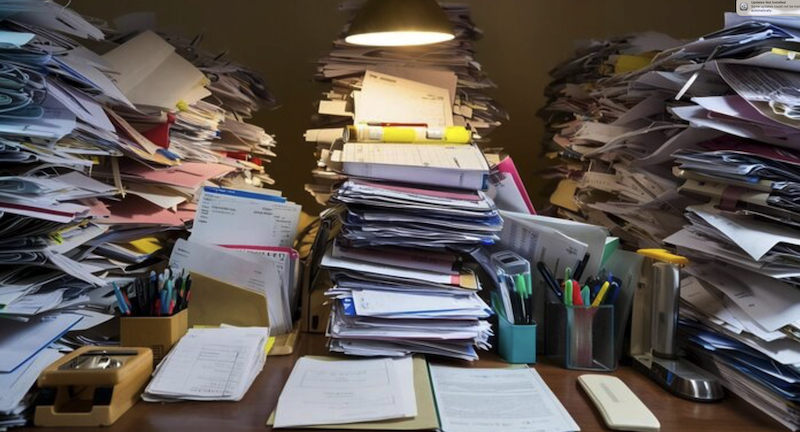
Inside, three desks littered with stacks of invoices, handwritten ledgers, and utility bills stuffed into manila envelopes filled the room. I realized he kept every aspect of his business on paper.
My job had just become even more complicated.
The Books
This was not my first rodeo helping owners figure out what was eating their profits. So, I started where I always did. I hit the usual suspects: vacancy, loss to lease, maintenance costs, property taxes, and payroll.
My pre-eliminary discovery had me scratching my head. At 89% occupancy and with a delinquency rate of less than 10%. For a class-C apartment complex, it was well within the benchmark for the location and age of the property.
By the end of the second day, I didn’t want to come back for the third. I was not a happy camper.
But on the third day, over a cup of gas station coffee, I found something promising.
Water Bills
If it were not for a manila folder that housed the water bills falling on my feet, I would have missed it. I was looking for the former residents’ ledgers when the folder fell to the ground. I shifted gears.
This is where things got interesting.
The water bill has been consistently rising over the last five years. Not just the usage, but the rates had changed drastically.
Opening my computer, I created a spreadsheet and entered every available water bill.
Reaching for a current resident ledger, I inspected the water charges. The number didn’t make sense. So, I checked another one. And another. The numbers were concerning me.
In the spreadsheet, I manually documented the charges passed to each customer and summed them by building. The property was recovering less than 50%.
They were using the Rate-Based Utility Billing System (RUBS), making it easier for me to reverse-engineer the formula. My first reaction was one of happiness because I had discovered a huge leak (pun intended). As I calculated the loss for the current month, my happiness quickly turned into concern.
Before panicking and telling the owner I found something, I wanted to be sure. I went through all the water bills and the charges being passed on to the residents.
In the first year alone, the property picked up $32k of the water bill. Not to mention other utilities.
Other Utilities
Following the trend, I audited all of the utilities. What I found was abysmal.
The property was paying for natural gas for the lamps around the property—a charming feature from when the complex was still in its prime. Except none of them worked.
They were paying $140 per month in minimum fees required by the gas company for the last five years. That’s $8,400 in pure waste.
Another massive loss was the power bill.
Technically, when someone moved in, they were supposed to switch the power bill to their name. But if they didn’t, there were no checks and balances. The property paid for those bills.
Another thing that was happening a lot was vacant units with high power usage. Upon further investigation, I learned that maintenance and vendors would crank the AC down to 65 to work in the unit. When the work was done, they would leave and completely forget about the AC.
After several years working in this industry, I learned this was not an isolated incident.
Property managers are already stretched thin; micromanaging something so granular as multiple utility bills can and will fall through the cracks.
But that doesn’t mean a solution is not available.
The Solution I Wish They’d Had
After seeing this pattern repeat across dozens of properties—different owners, different markets, same invisible profit leaks—I realized something:
Property managers aren’t trained to identify anomalies in the data or spot patterns.
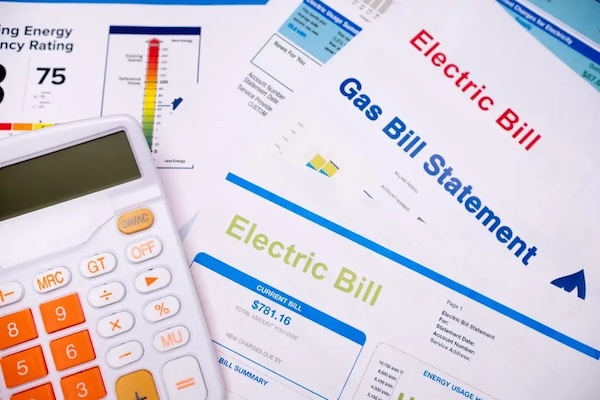
Utility bills arrive as line-item PDFs. Your PMS tracks what you bill residents, but not the gap between what you pay and what you recover. Excel spreadsheets require manual updates that never happen.
That’s why I built the Utilities Management Dashboard.
What It Tracks:
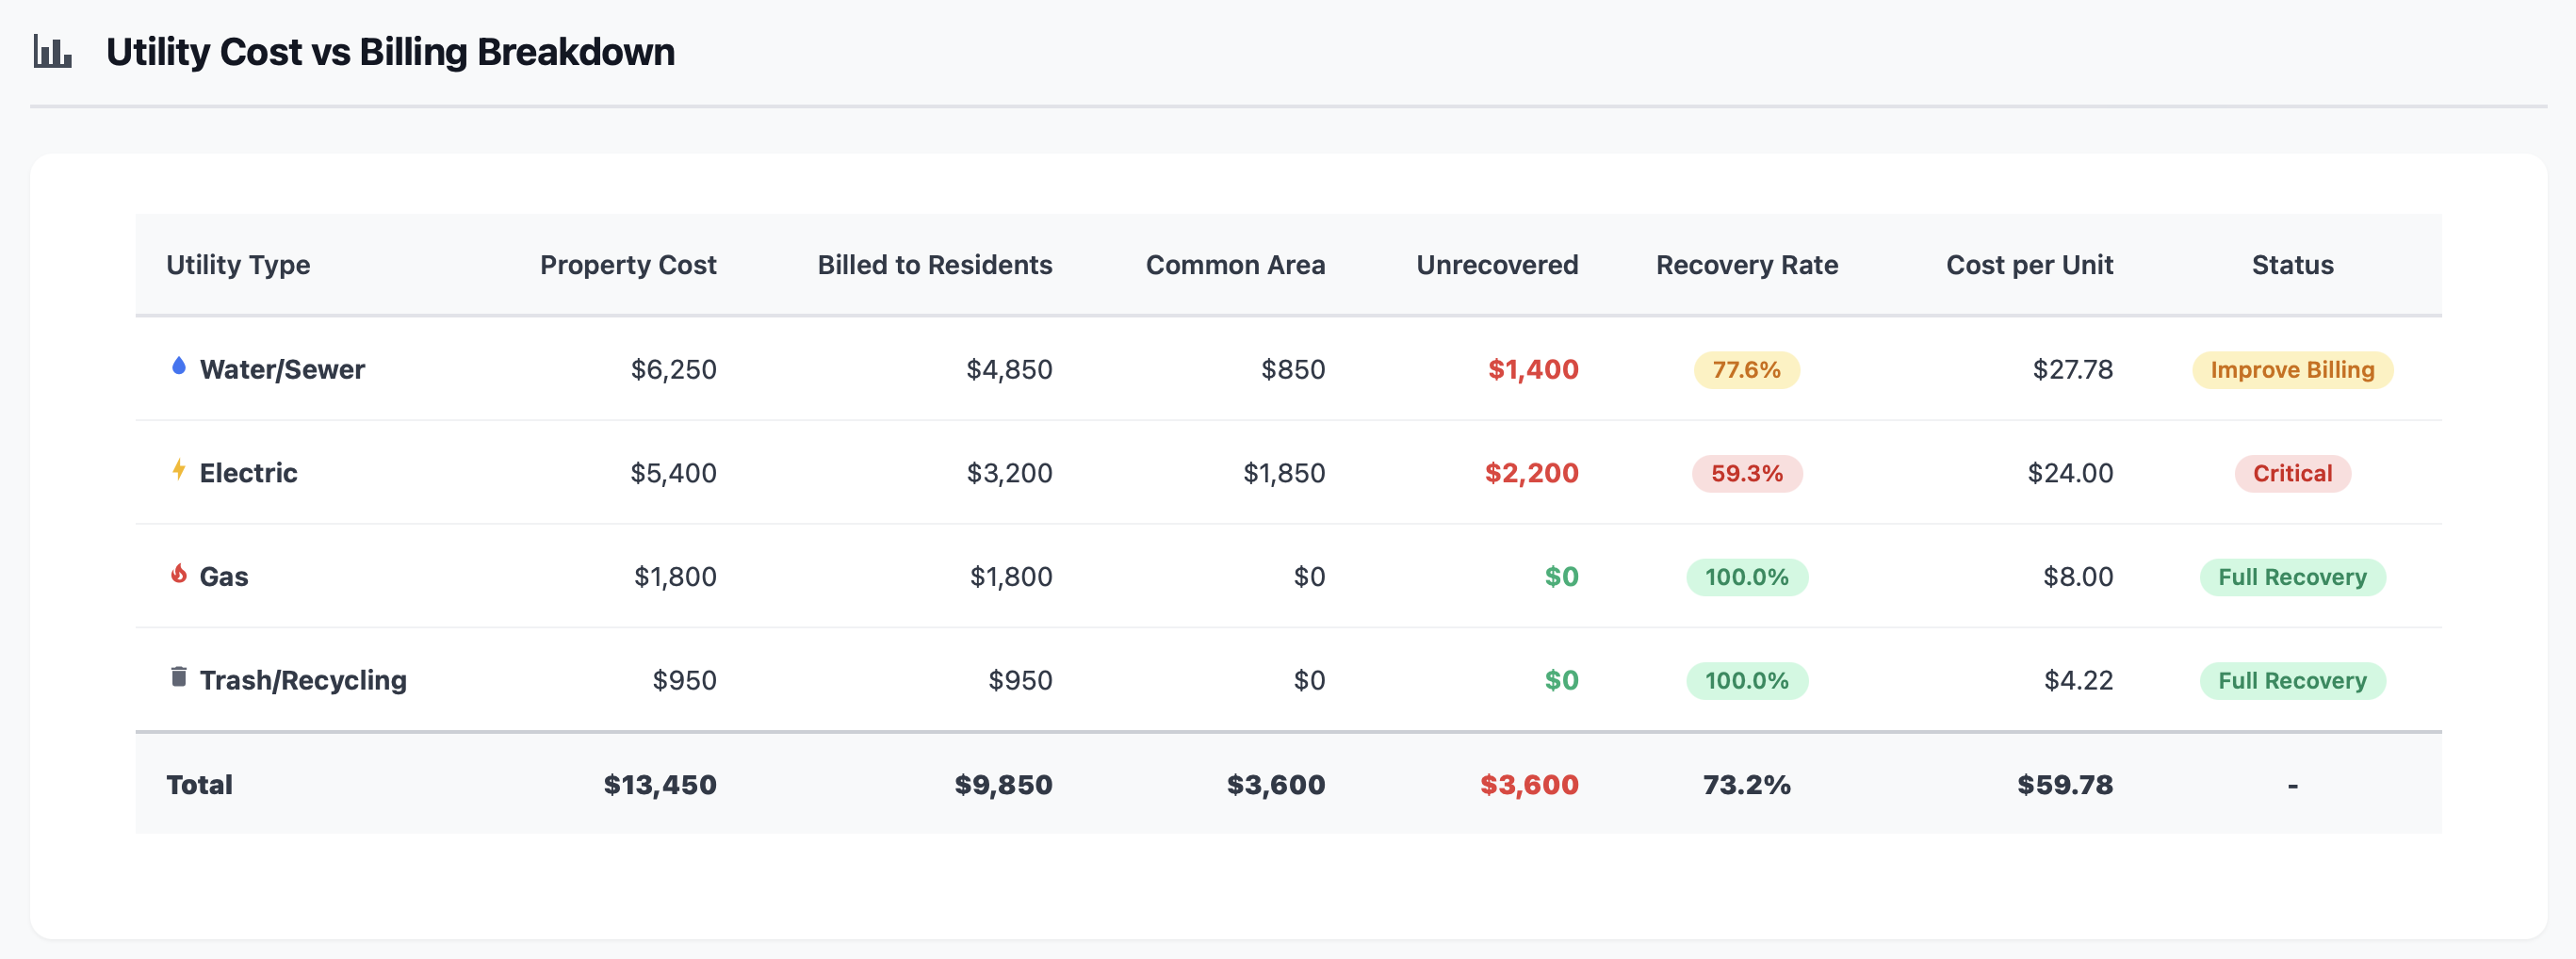
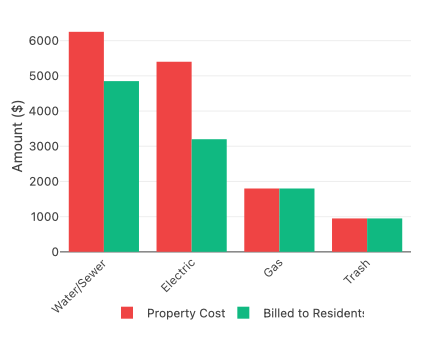
Cost vs. Recovery: See at a glance whether you’re recovering 50%, 80%, or 100% of your utility costs. No manual calculations required.
Trend Analysis:
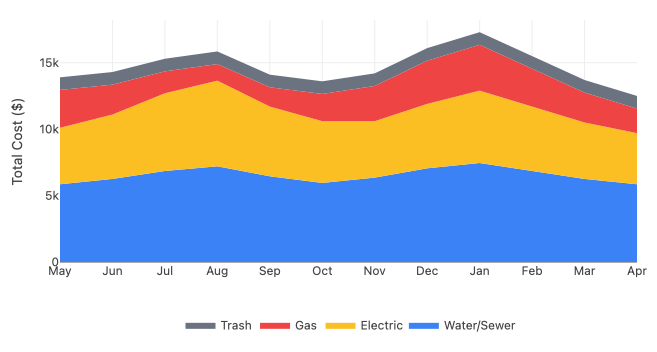
Spot when recovery rates start declining—before it costs you $30K.
Recovery Rate by Building:
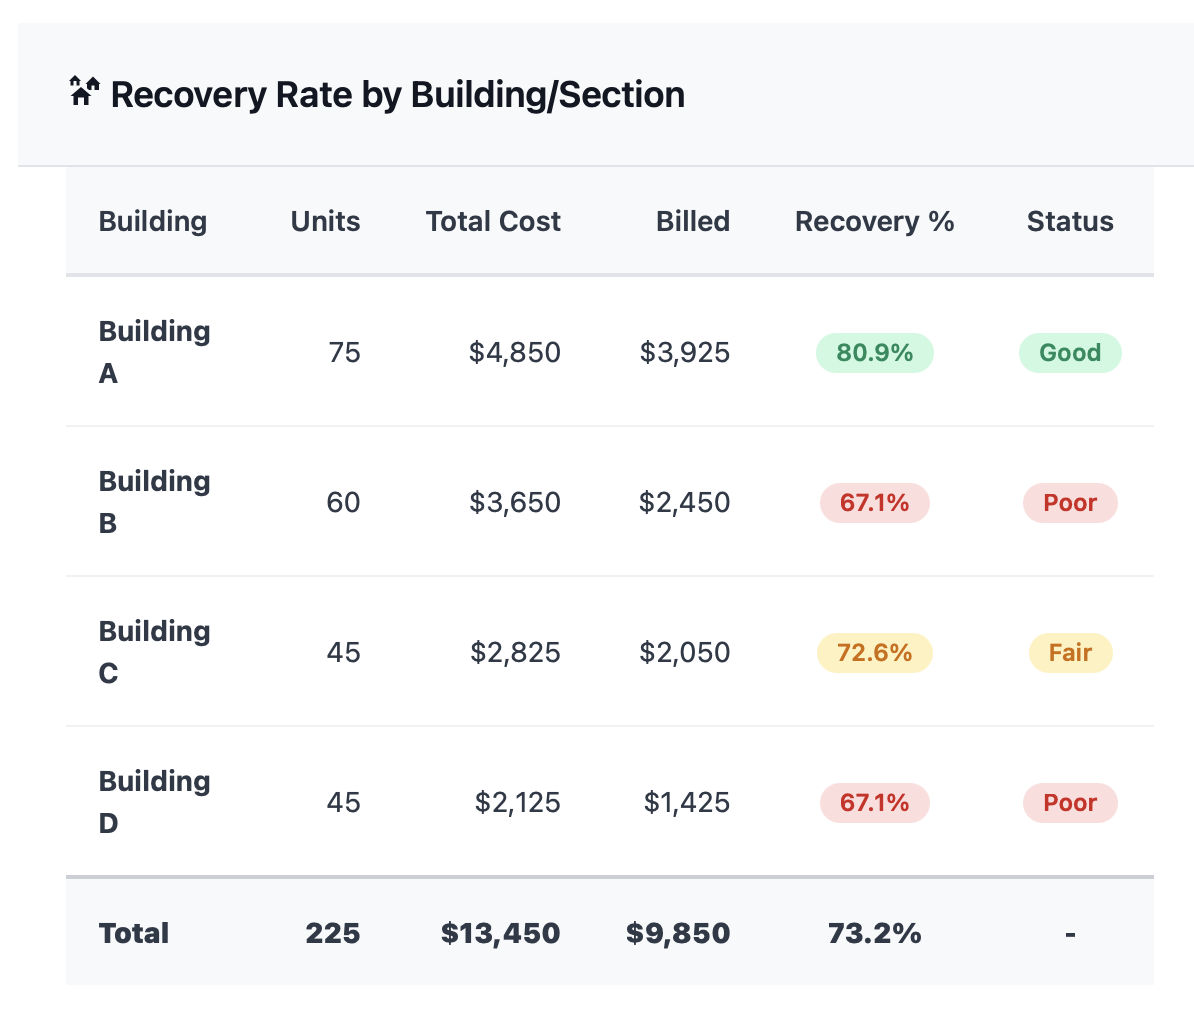
Flag the buildings with abnormal usage. Catch the “AC running at 65 for three months” problem immediately.
Utility Rate Changes: Get alerted when your city raises rates so you can update your RUBS formula before it costs you. Historical Comparison: See year-over-year trends. Know if your utility costs are climbing faster than your recovery.
How It Works:
The dashboard connects directly to your property management software. No extra data entry. No manual uploads. Just automatic visibility into what’s actually happening with your utilities. One glance tells you:
✅ Which utilities are profitable ⚠️ Which are leaking money 🚨 Which need immediate attention
Don’t Let Utilities Silently Drain Your Profits
Every property I’ve analyzed has some version of this problem:
RUBS formulas that haven’t been updated
Vacant units running at full power
Services billing for amenities that don’t exist
Recovery rates declining month after month
The only difference between the properties losing money and those recovering it? Visibility.
Ready to See What You’re Missing?
If you’re curious what your numbers look like, I’ll run a free analysis using your actual utility bills.
You’ll get a full cost-vs-recovery breakdown, building-level anomalies, and alerts for anything bleeding money. No commitments—just clarity.
No comments yet. Be the first.