Utilities Management Dashboard
Track water, electric, gas, and trash costs vs. resident billings in real-time. Most properties discover 68-75% recovery rates and recover $30K-60K+ annually by improving to 80-85% recovery through better visibility and billing accuracy.
Getting Started
1️⃣ Connect Your Systems Link your property management system, utility billing provider, and accounting system. We’ll map utility costs and resident billings automatically.
2️⃣ Import Historical Data Pull in 12-24 months of utility costs and billing data. This establishes your baseline recovery rate and seasonal patterns.
3️⃣ Configure Common Areas Document all common area utility costs (clubhouse, lighting, irrigation, pool). Separate these from recoverable resident costs.
4️⃣ Start Recovering More Day one: See your recovery rate and unrecovered costs. Week one: Identify your worst-performing utility or building. Month one: Fix your first billing issue and start recovering more costs.
Stop Subsidizing Resident Utility Costs: Utilities Management
Stop leaving thousands on the table. See exactly how much utility cost you’re absorbing vs. billing back to residents—and fix the gap.
Break down costs by utility type, building, and common area. Know your true cost per unit and identify where recovery is failing.
Compare recovery rates across buildings, track trends over time, and identify opportunities to improve billing accuracy and efficiency.
The Utility Cost Problem Draining Your NOI
If you’re managing multifamily utilities, these challenges are silently killing your margins:
⚠️ Unknown recovery rates: No idea what percentage of utility costs you’re actually recovering
⚠️ Common area confusion: Which costs are legitimately common area vs. under-billed residents?
⚠️ Building-level blindness: Building B has terrible recovery but you don’t know why
⚠️ Seasonal surprises: Summer electric bills spike but billing doesn’t keep pace
⚠️ Budget variance chaos: Utility costs trending 15% over budget with no explanation
⚠️ Manual reconciliation nightmare: Spending hours each month matching bills to resident charges
Poor utility cost recovery = $2K-8K monthly NOI loss per property. Time to plug the leak.
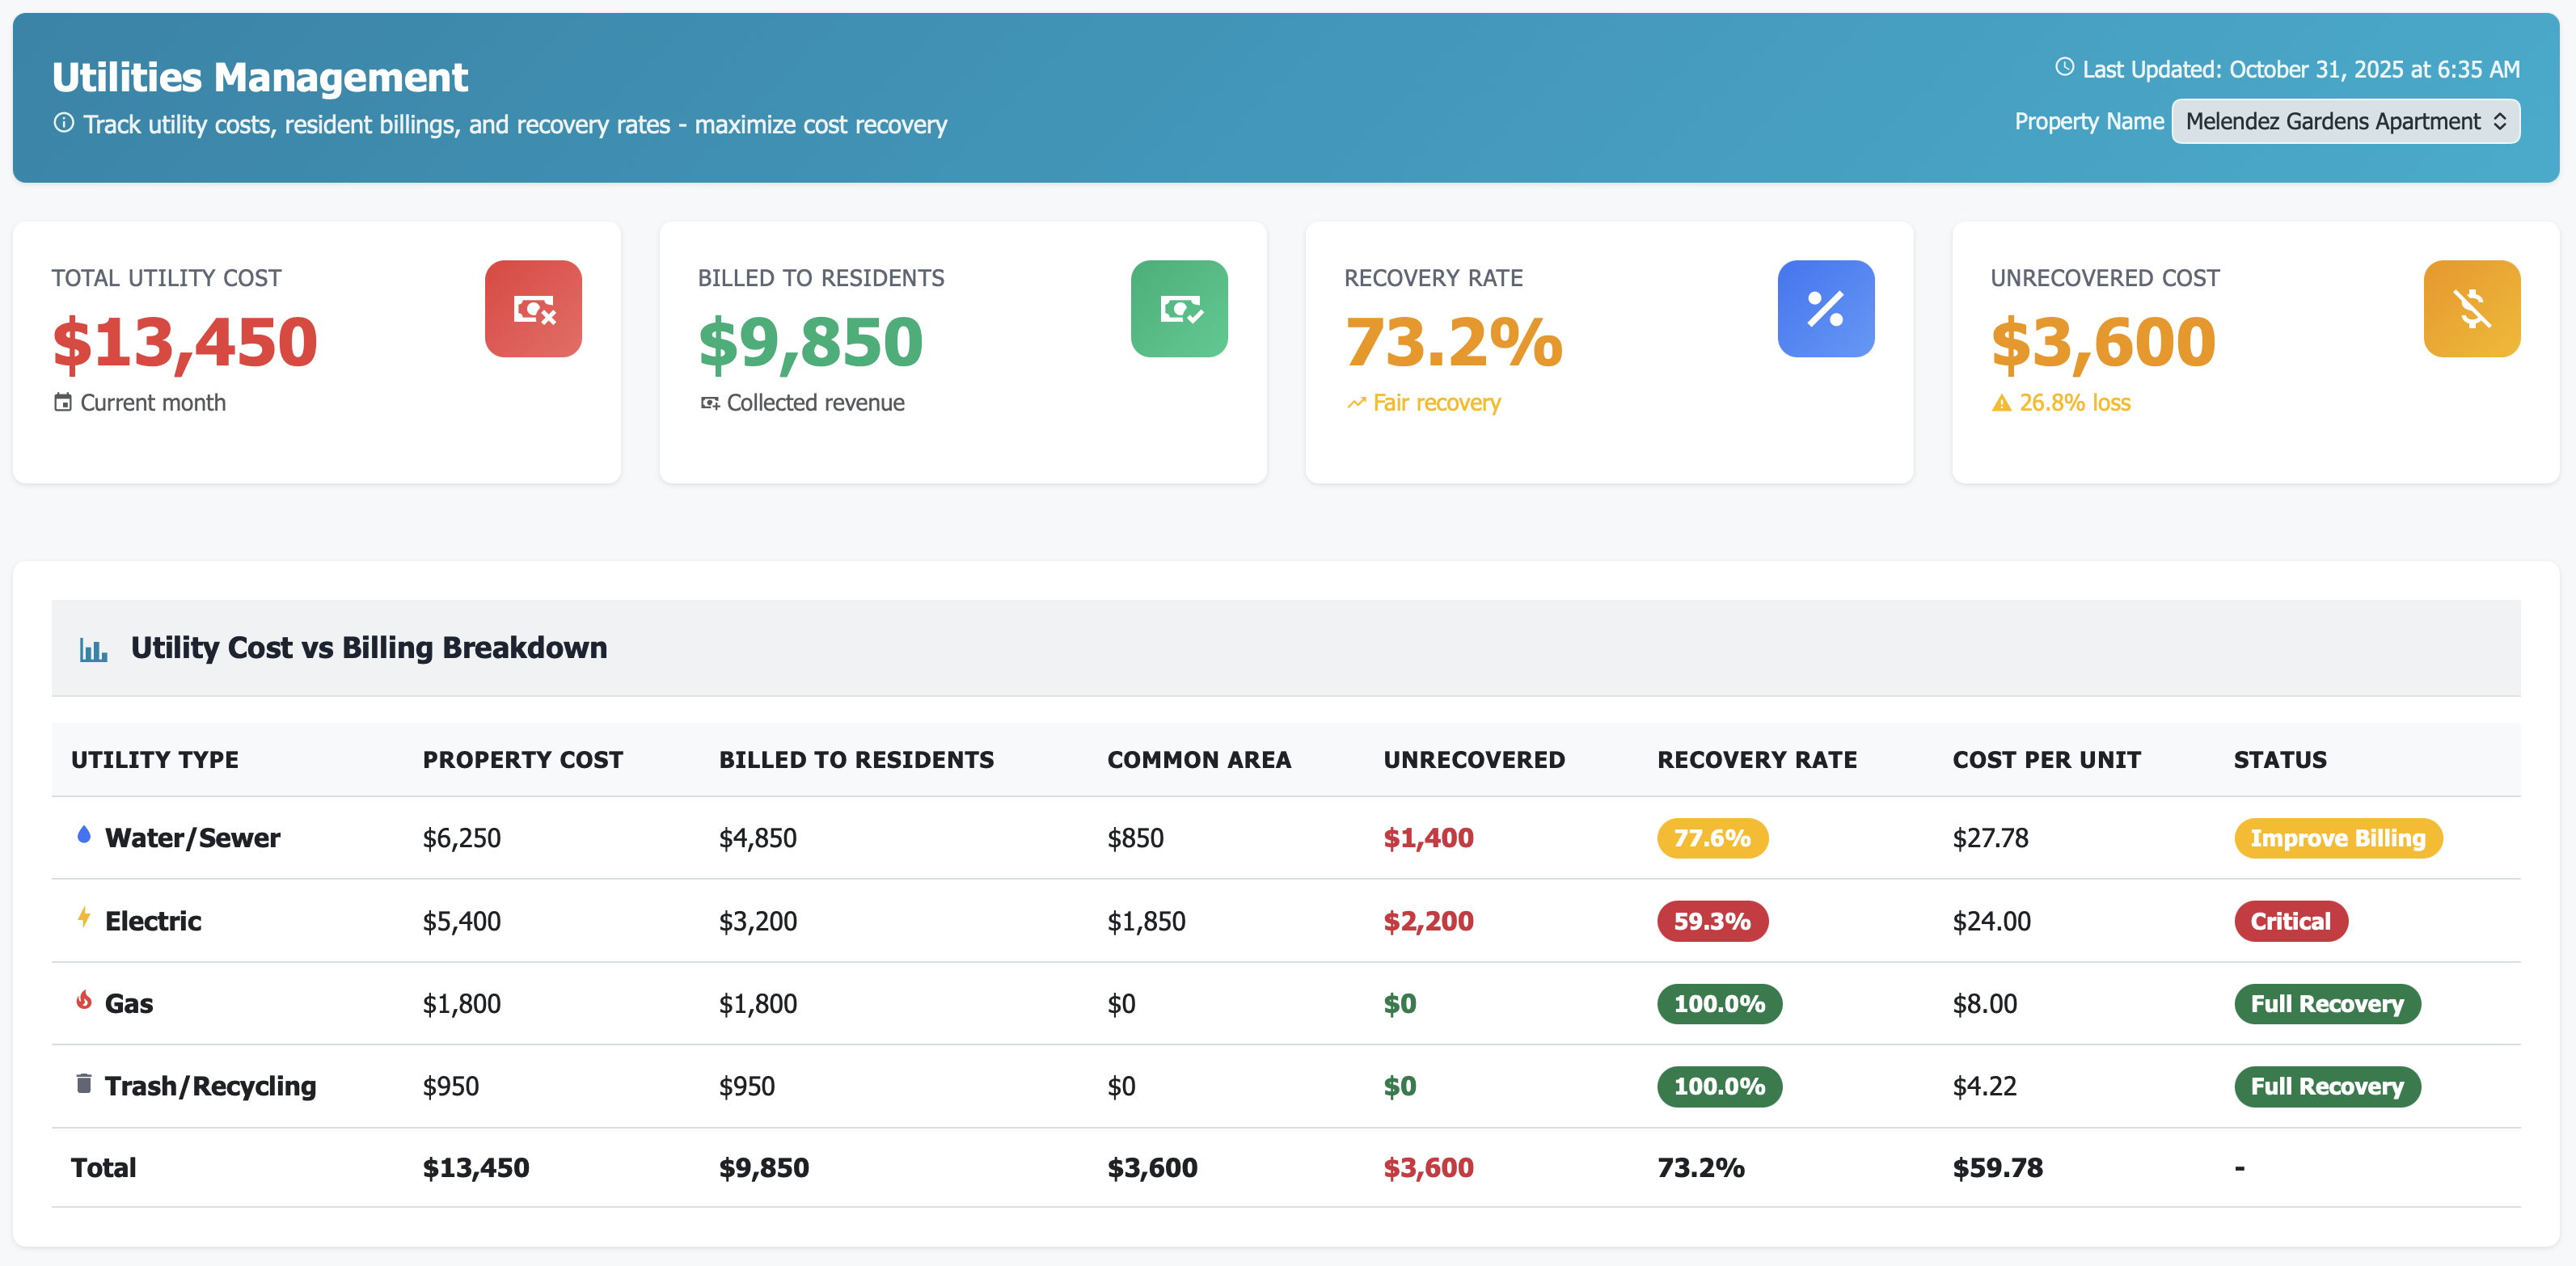
Your New Reality: Complete Utility Intelligence
Cost vs Recovery at a Glance
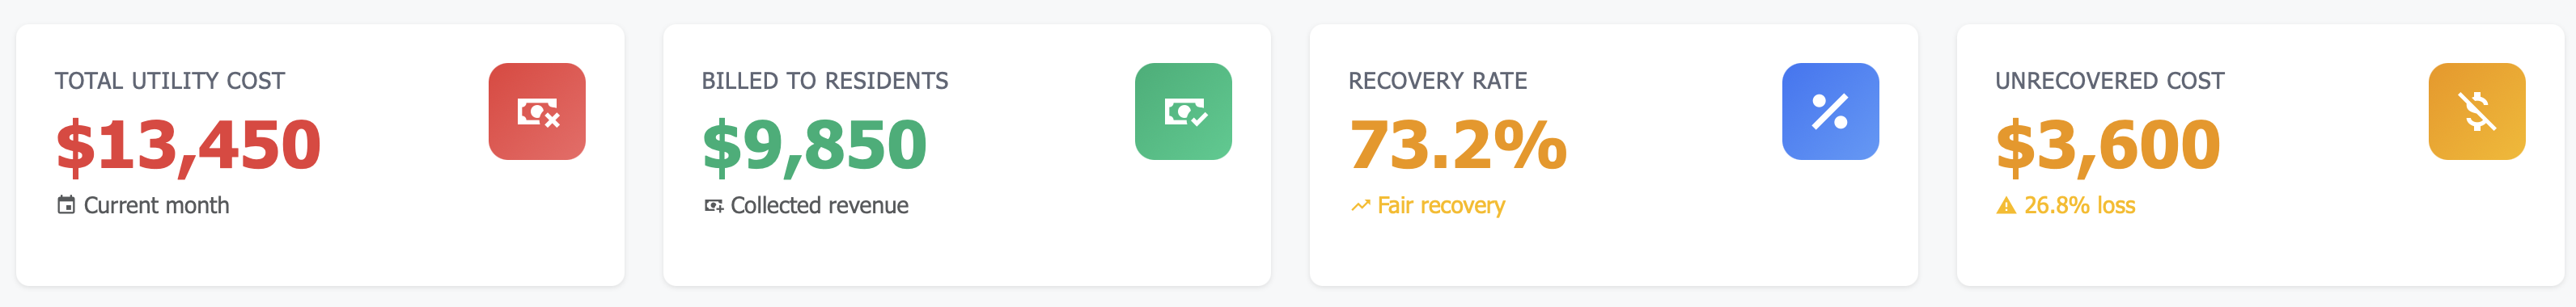
Four critical numbers always visible:
Total utility cost this month
Amount billed to residents
Recovery rate percentage
Unrecovered cost (your loss)
Instant visibility into your biggest expense leak
Utility Type Breakdown
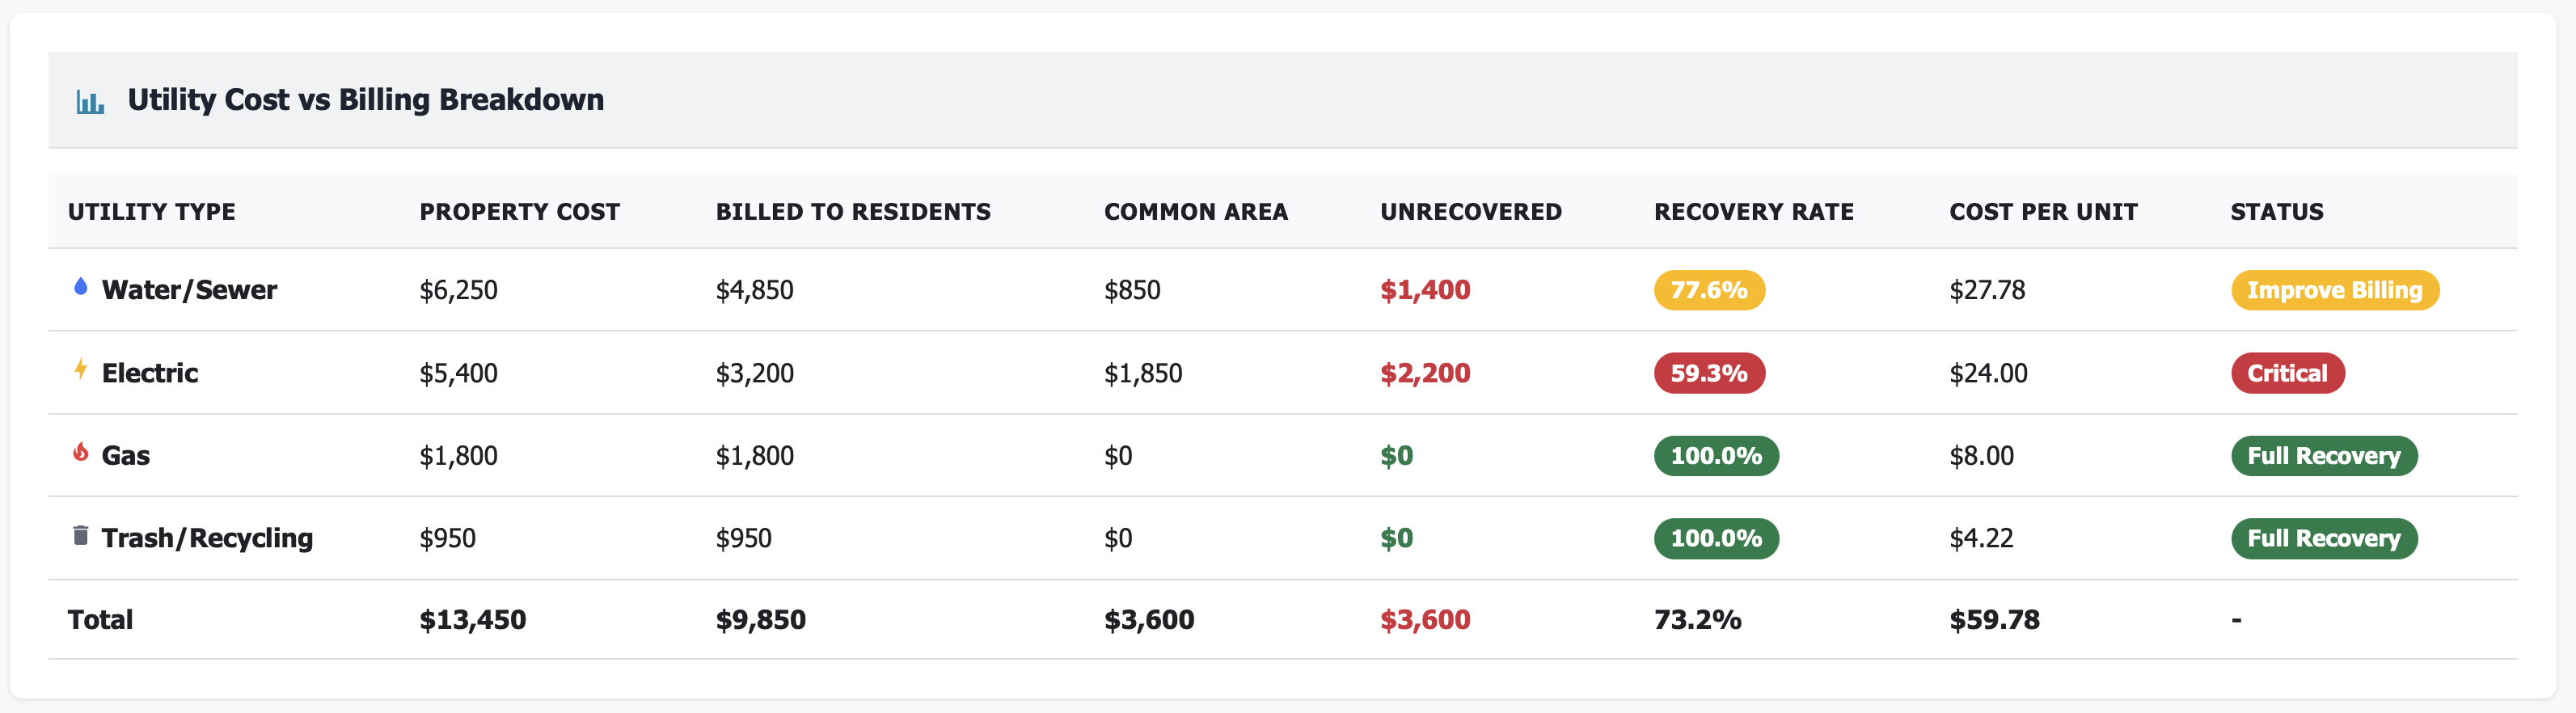
Detailed analysis by utility:
Water/Sewer costs and recovery
Electric costs and recovery
Gas costs and recovery
Trash/recycling costs
Cost per unit for each type
Identify which utilities are the problem
Recovery Rate by Building
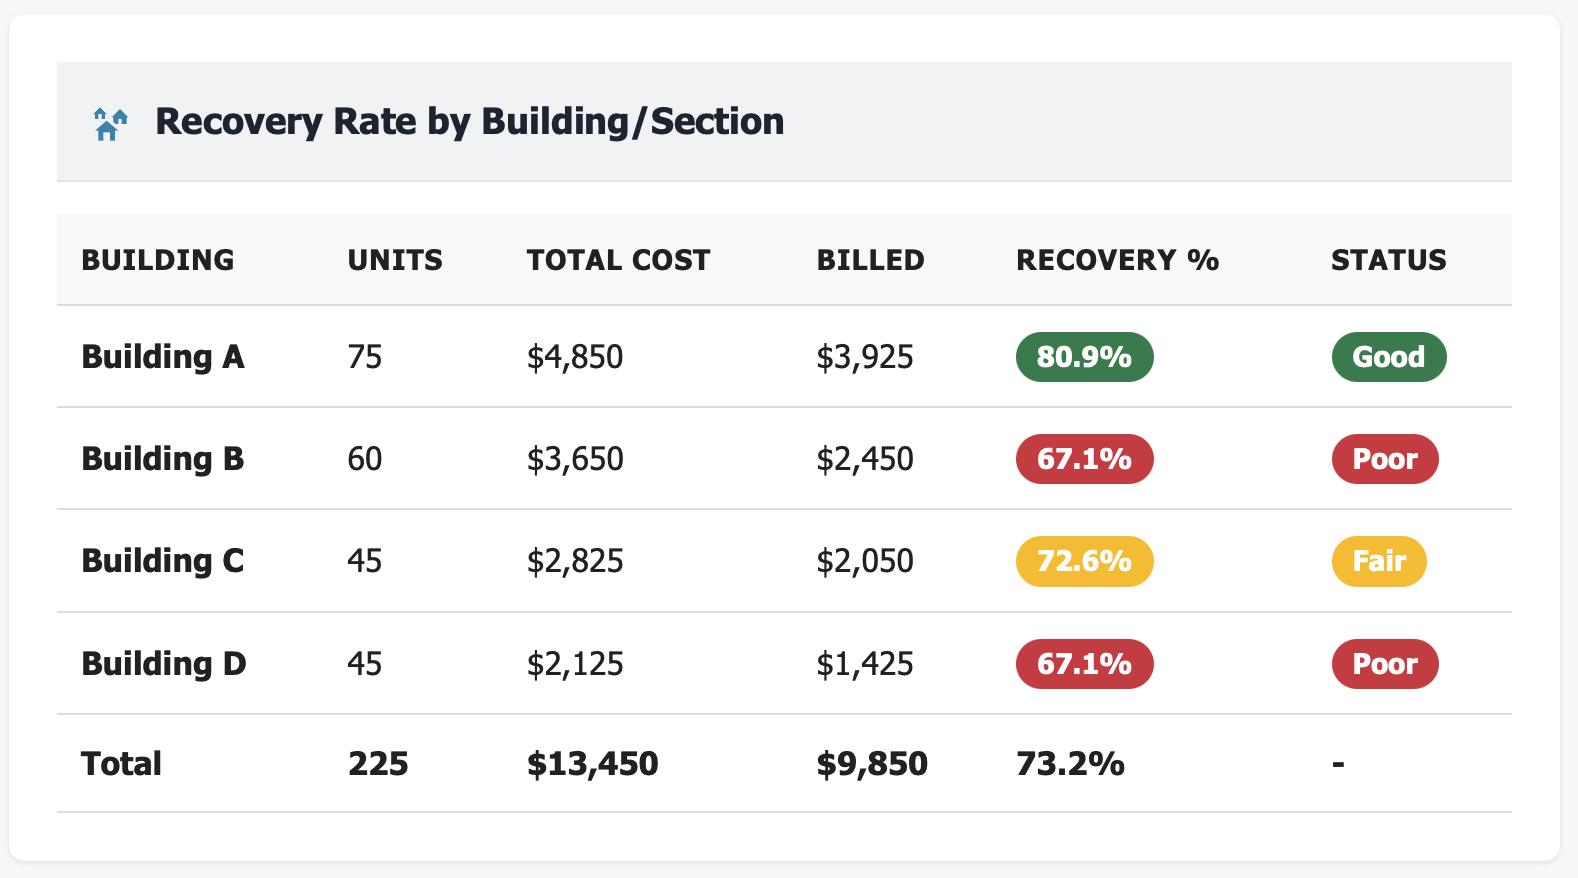
Building-level performance:
Recovery rate by building/section
Units and total costs per building
Status indicators (Good, Fair, Poor)
Immediate identification of problem areas
Compare and fix underperforming buildings
Real Results: From Utility Loss to Full Recovery
Metric |
Before Utility Dashboard |
After 6 Months |
|---|---|---|
Utility cost recovery rate |
Unknown (estimated 65%) |
84% (tracked & optimized) |
Monthly unrecovered costs |
$6,800 (untracked) |
$2,100 (down 69%) |
Time on utility reconciliation |
8 hours/month |
45 minutes/month |
Common area cost accuracy |
Estimated/guessed |
Tracked & verified |
Building-level visibility |
None |
Complete transparency |
Annual utility cost savings |
— |
$56,400 recovered |
Features That Maximize Recovery
💰 Recovery Rate Tracking
See your overall recovery rate and track it month-over-month. Set targets (80%? 85%?) and monitor progress. Get alerts when recovery drops below threshold.
📊 Utility Type Analysis
Break down costs by water/sewer, electric, gas, and trash. See which utility has the worst recovery. Understand cost per unit by type. Identify billing gaps.
🏢 Building-Level Performance
Compare recovery rates across buildings. Identify which buildings are subsidizing resident costs. Investigate why Building B recovers 67% while Building A recovers 81%.
🏛️ Common Area Cost Tracking
Separate and track common area utility costs:
Clubhouse electric (pool, HVAC, lighting)
Hallway and parking lot lighting
Landscape irrigation
Pool water and chemicals
Office utilities
Know your true common area burden.
📈 Monthly Trend Analysis
12-month view of total utility costs by type. See seasonal patterns (summer electric spikes, winter gas increases). Compare year-over-year. Identify unusual cost increases early.
💡 Cost Per Unit Benchmarking
Track average utility cost per unit by unit type:
Studio: $42/month
1BR: $52/month
2BR: $68/month
3BR: $86/month
Compare to market norms and identify anomalies.
🎯 Unrecovered Cost Visibility
Big, bold number showing exactly how much you’re absorbing monthly. Break down unrecovered costs by utility type. Calculate annual impact. Make the case for billing improvements.
📉 Recovery Rate Trends
6-month trend line showing whether recovery is improving or declining. Compare to target rate. Identify which changes improved (or hurt) recovery.
🔍 Detailed Billing Breakdown
See property cost vs. amount billed to residents for each utility. Identify discrepancies. Ensure billing formulas are working correctly.
Perfect For
Property Managers
Maximize NOI by ensuring you’re recovering the maximum allowable utility costs from residents through accurate tracking and billing
Asset Managers
Monitor utility cost recovery across portfolios, identify underperforming properties, and implement best practices at scale
Portfolio Owners
Understand true utility costs, common area burdens, and recovery rates to make informed decisions about RUBS programs and capital improvements
Use Case: Recovering $56K Annually in Lost Utility Costs
Real Customer Story
Challenge: A 225-unit property knew utility costs were high, but had no visibility into recovery rates. The property manager “felt like” they were losing money on utilities but couldn’t quantify it.
Dashboard Revealed:
Overall recovery rate: 68% (vs. 85%+ industry standard)
Electric recovery: only 59% (terrible)
Building B: 62% recovery vs. Building A: 81% recovery
Common area costs: $3,600/month (more than estimated)
Unrecovered costs: \(6,800/month (\)81,600 annually)
Summer electric billing lagging actual costs by 30%+
Action Taken:
Electric submeter audit: Discovered 18 units with malfunctioning submeters (not billing accurately)
Building B investigation: Found master meter issue causing under-billing for entire building
Seasonal billing adjustments: Updated RUBS formula to better reflect summer AC usage
Common area allocation: Properly separated and documented all common area costs
Billing system upgrade: Switched to more accurate utility billing software
Monthly monitoring: Set up dashboard alerts for recovery rates below 80%
Results After 12 Months:
Overall recovery rate: 84% (up from 68%)
Electric recovery: 78% (up from 59%)
Building B recovery: 79% (up from 62%)
Monthly unrecovered costs: \(2,100 (down from \)6,800)
Annual savings: $56,400 recovered
Time savings: 8 hours/month → 45 minutes/month on reconciliation
Total impact: $56K+ additional annual NOI + 7 hours/month time savings
“We were literally subsidizing $6,800 per month in utility costs and had no idea. The dashboard paid for itself in week one.” — Property Manager
Key Utility Metrics You’ll Track
Technical Integration (Works With Your Stack)
Frequently Asked Questions
Q: Can I track RUBS and direct-billed utilities together? A: Yes. The dashboard handles both ratio utility billing systems (RUBS) and individually metered/submetered units in one view.
Q: What if utilities are included in rent? A: You can still track total costs, cost per unit, and trends to inform rent pricing decisions and identify energy efficiency opportunities.
Q: Can I compare to other properties or benchmarks? A: Yes. Compare your cost per unit and recovery rates to portfolio averages or market benchmarks.
Q: How do you handle seasonal variations? A: The dashboard shows 12-month trends so you can see seasonal patterns (summer electric spikes, winter gas increases) and plan accordingly.
Q: Can I export utility reports for ownership? A: Absolutely. One-click exports to PDF or Excel. Schedule automated monthly utility reports to stakeholders.
Q: Does this replace my utility billing provider? A: No. Your billing provider still handles calculations and resident billing. The dashboard analyzes and visualizes that data for better decision-making.
Stop Subsidizing Utility Costs
Every month without utility visibility means:
Thousands in unrecovered costs draining NOI
Residents under-paying while you absorb the difference
Problem buildings going unidentified
Billing errors compounding month after month
No leverage to negotiate with utility providers
Your best-performing properties track and optimize utility recovery.
The question isn’t whether you need utility intelligence.
The question is: How much are you losing to poor utility recovery right now?
Related Topics
Ready to Get Started?
Schedule a personalized demo to see this dashboard in action.
Schedule Demo Contact Sales