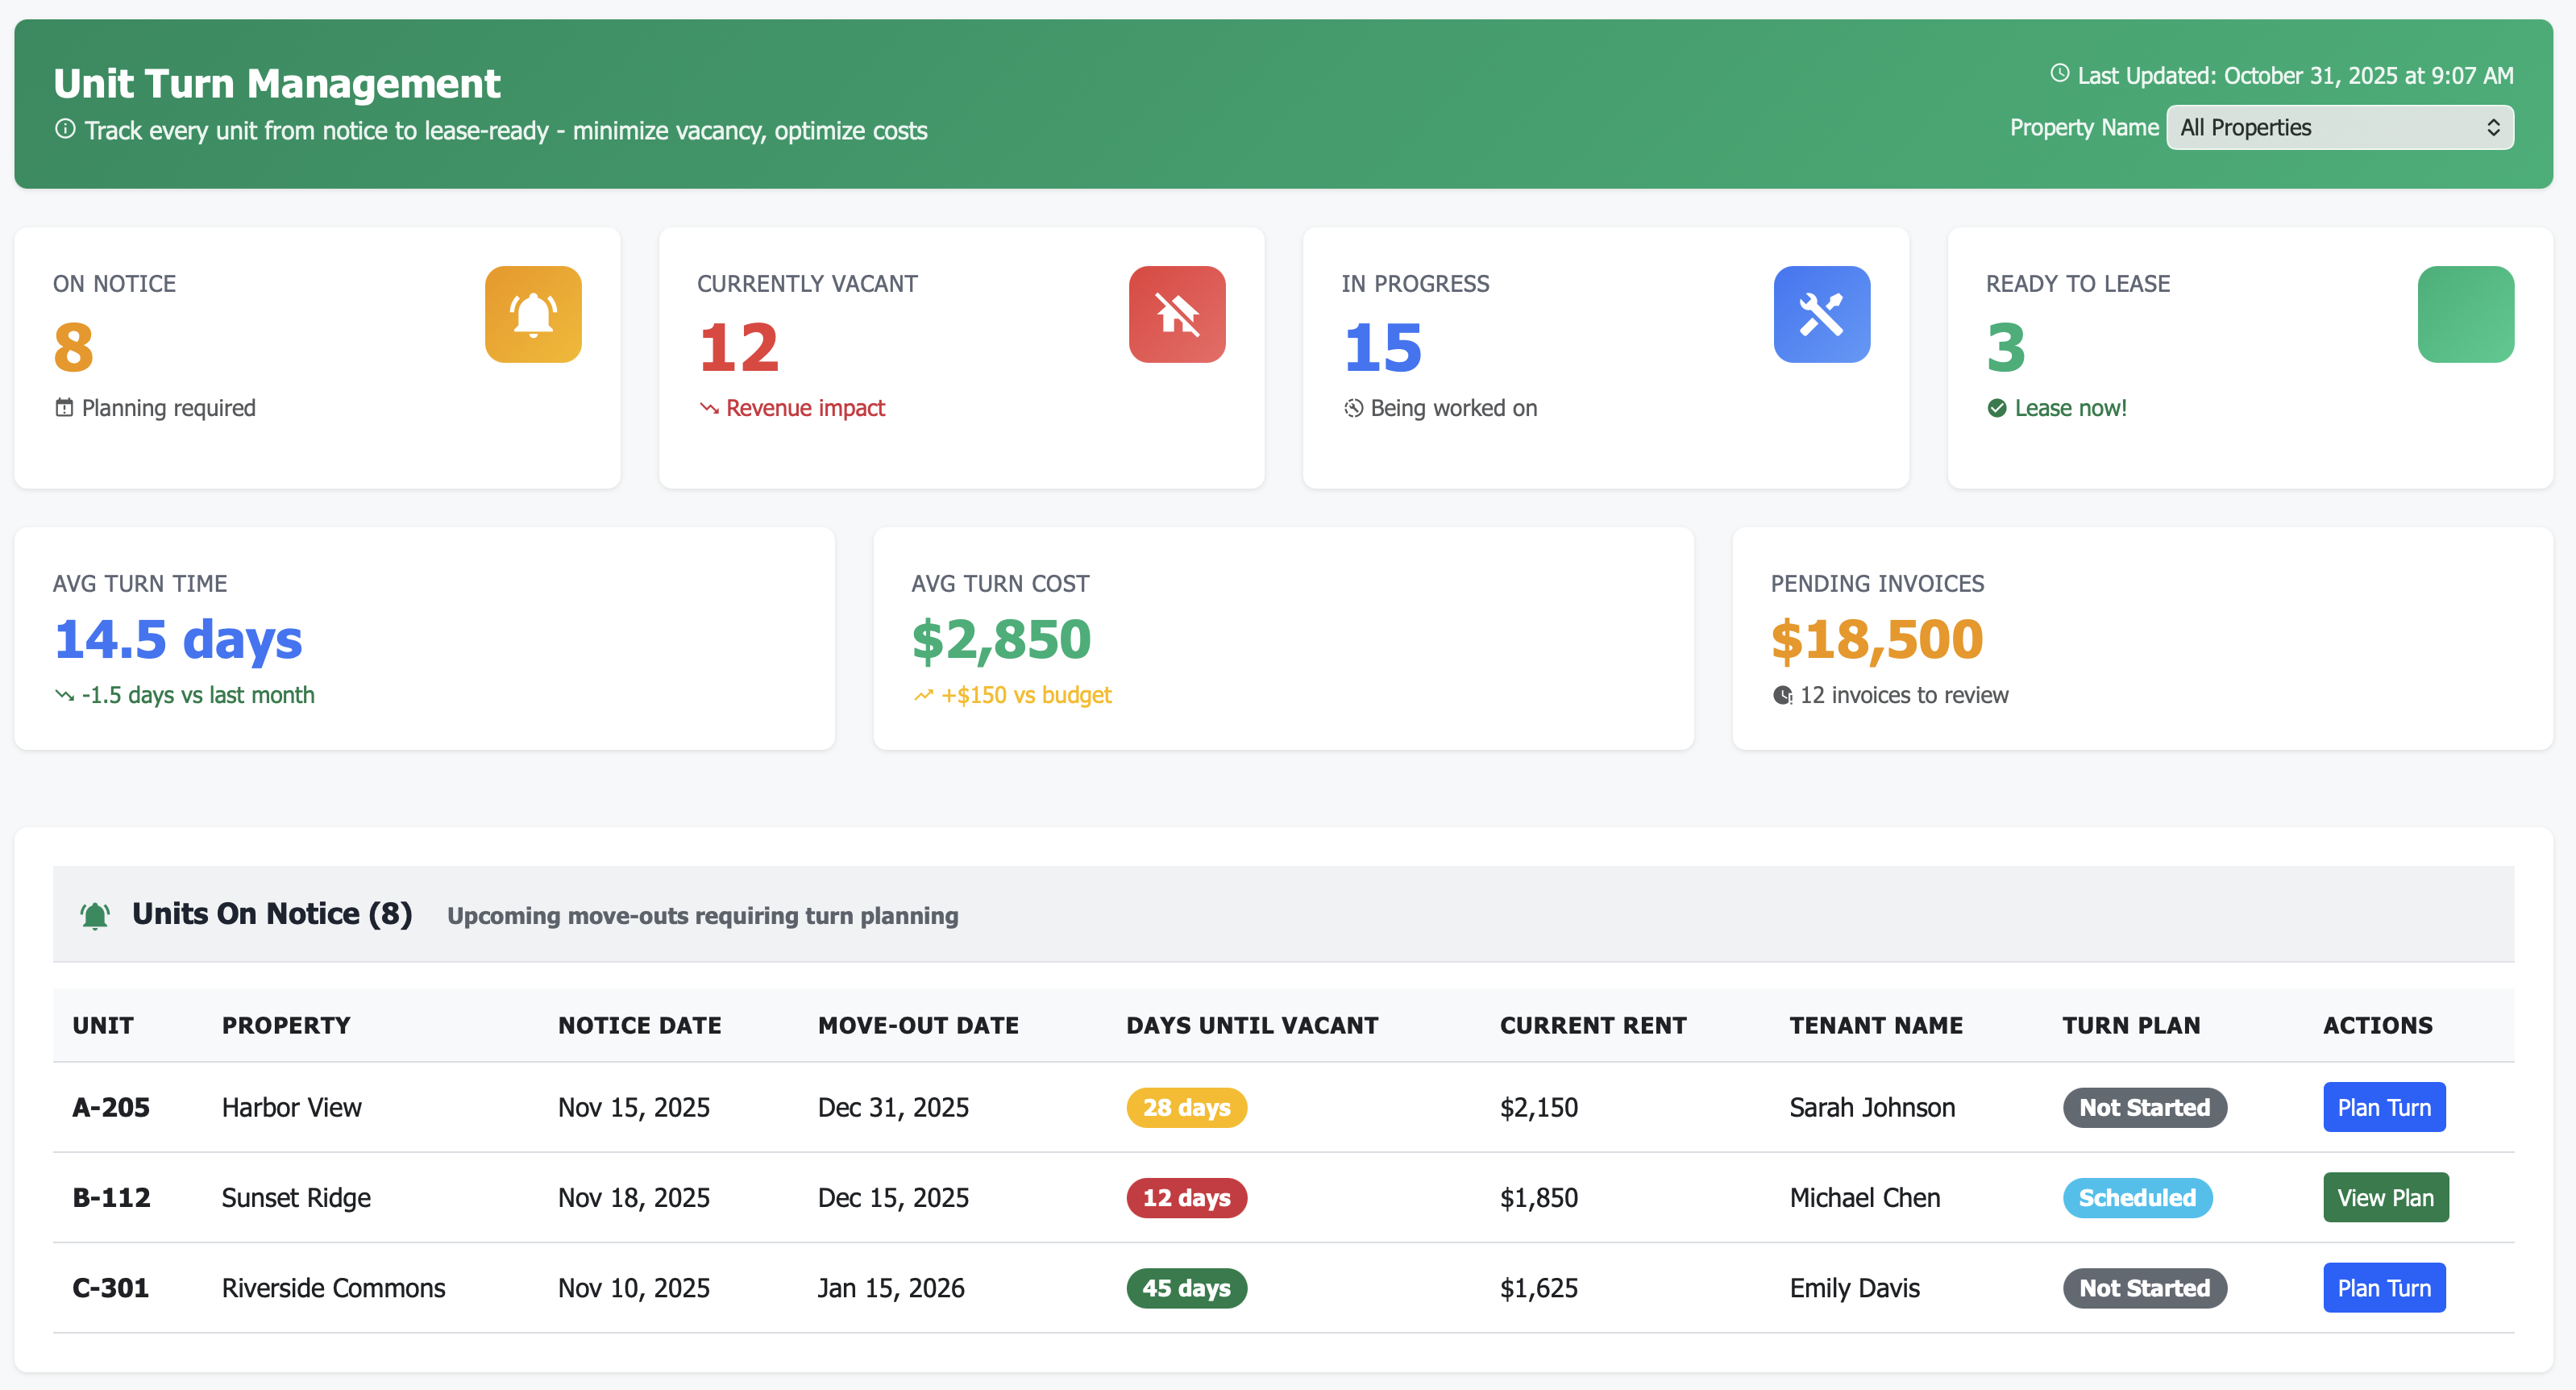
Unit Turn Management Dashboard
Track every unit from notice to lease-ready, see exactly which stage each turn is in, and hold vendors accountable. Most properties reduce turn time from 18+ days to 12-14 days, recovering $50K-150K+ annually in lost rent through faster, more consistent turnover.
Getting Started
1️⃣ Connect Your Systems Link your property management system and any maintenance/work order tools you use. We’ll import current vacant units, notices, and work orders.
2️⃣ Import Historical Turn Data Pull in 6-12 months of historical turn data (move-out dates, ready dates, costs). This establishes your baseline turn time and cost benchmarks.
3️⃣ Configure Vendors & Processes Add your vendors to the system with contact info, categories, and any existing performance data. Map your turn process stages (inspection, painting, flooring, cleaning, etc.).
4️⃣ Start Optimizing Day one: See your current turn pipeline and where each unit stands. Week one: Identify your slowest property or biggest bottleneck. Month one: Implement your first process improvement and track the impact.
Turn Chaos into Clockwork: Unit Turn Management
Track every unit from notice to lease-ready. Know exactly where each turn stands, which are delayed, and what’s blocking progress—in real-time.
See exactly what each turn costs, compare across properties, and identify which vendors are efficient vs. expensive. Stop budget-busting turnover surprises.
Reduce average turn time from 18 days to 12 days through better visibility, vendor accountability, and process optimization. Every day saved = revenue recovered.
The Turn Management Problem Killing Your NOI
If you’re managing unit turns across multiple properties, these problems are costing you thousands monthly:
⚠️ Turn time blindness: No idea how long turns actually take until the unit sits vacant for 3 weeks
⚠️ Cost unpredictability: Turnover costs vary wildly—\(1,800 one month, \)4,200 the next—with no explanation
⚠️ Vendor chaos: Multiple vendors, unclear timelines, no accountability for delays
⚠️ Notice-to-ready gap: Resident gives 30 days notice, but unit isn’t ready for 45+ days
⚠️ Property-level inconsistency: One property averages 12 days, another averages 19 days—why?
⚠️ Invoice bottleneck: Vendor invoices pile up, sit in “review” for weeks, delay payments
⚠️ Work stage mystery: Is the unit being painted? Waiting on carpet? No one knows.
Poor turn management = 8-15 extra vacancy days per turn = $15K-30K annual loss per property. Time to fix it.
Your New Reality: Complete Turn Visibility
Turn Stage Pipeline
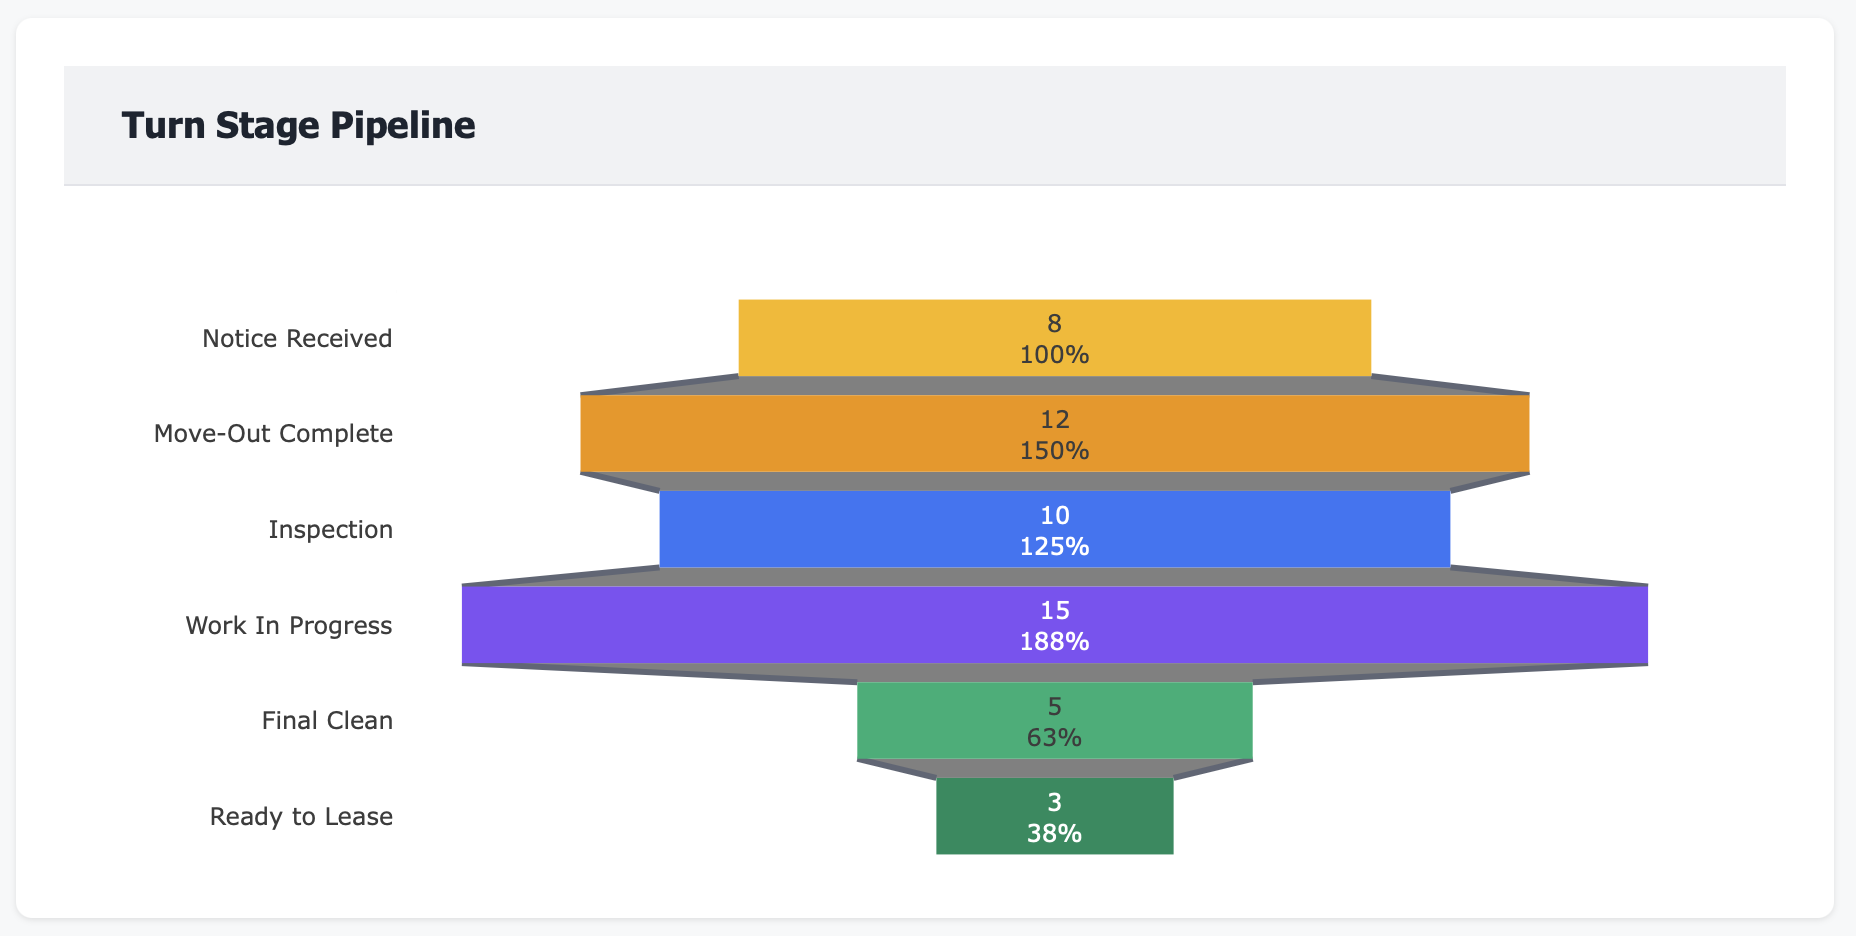
See every unit in the pipeline:
Notice received (8 units)
Move-out complete (12 units)
Inspection done (10 units)
Work in progress (15 units)
Final clean (5 units)
Ready to lease (3 units)
Know your pipeline at all times
Turn Time by Property
Compare property performance:
Harbor View: 12.5 days (excellent)
Sunset Ridge: 14.2 days (on target)
Riverside Commons: 16.8 days (needs improvement)
Parkview Estates: 18.5 days (problematic)
Benchmark and optimize across portfolio
Vendor Performance Tracking
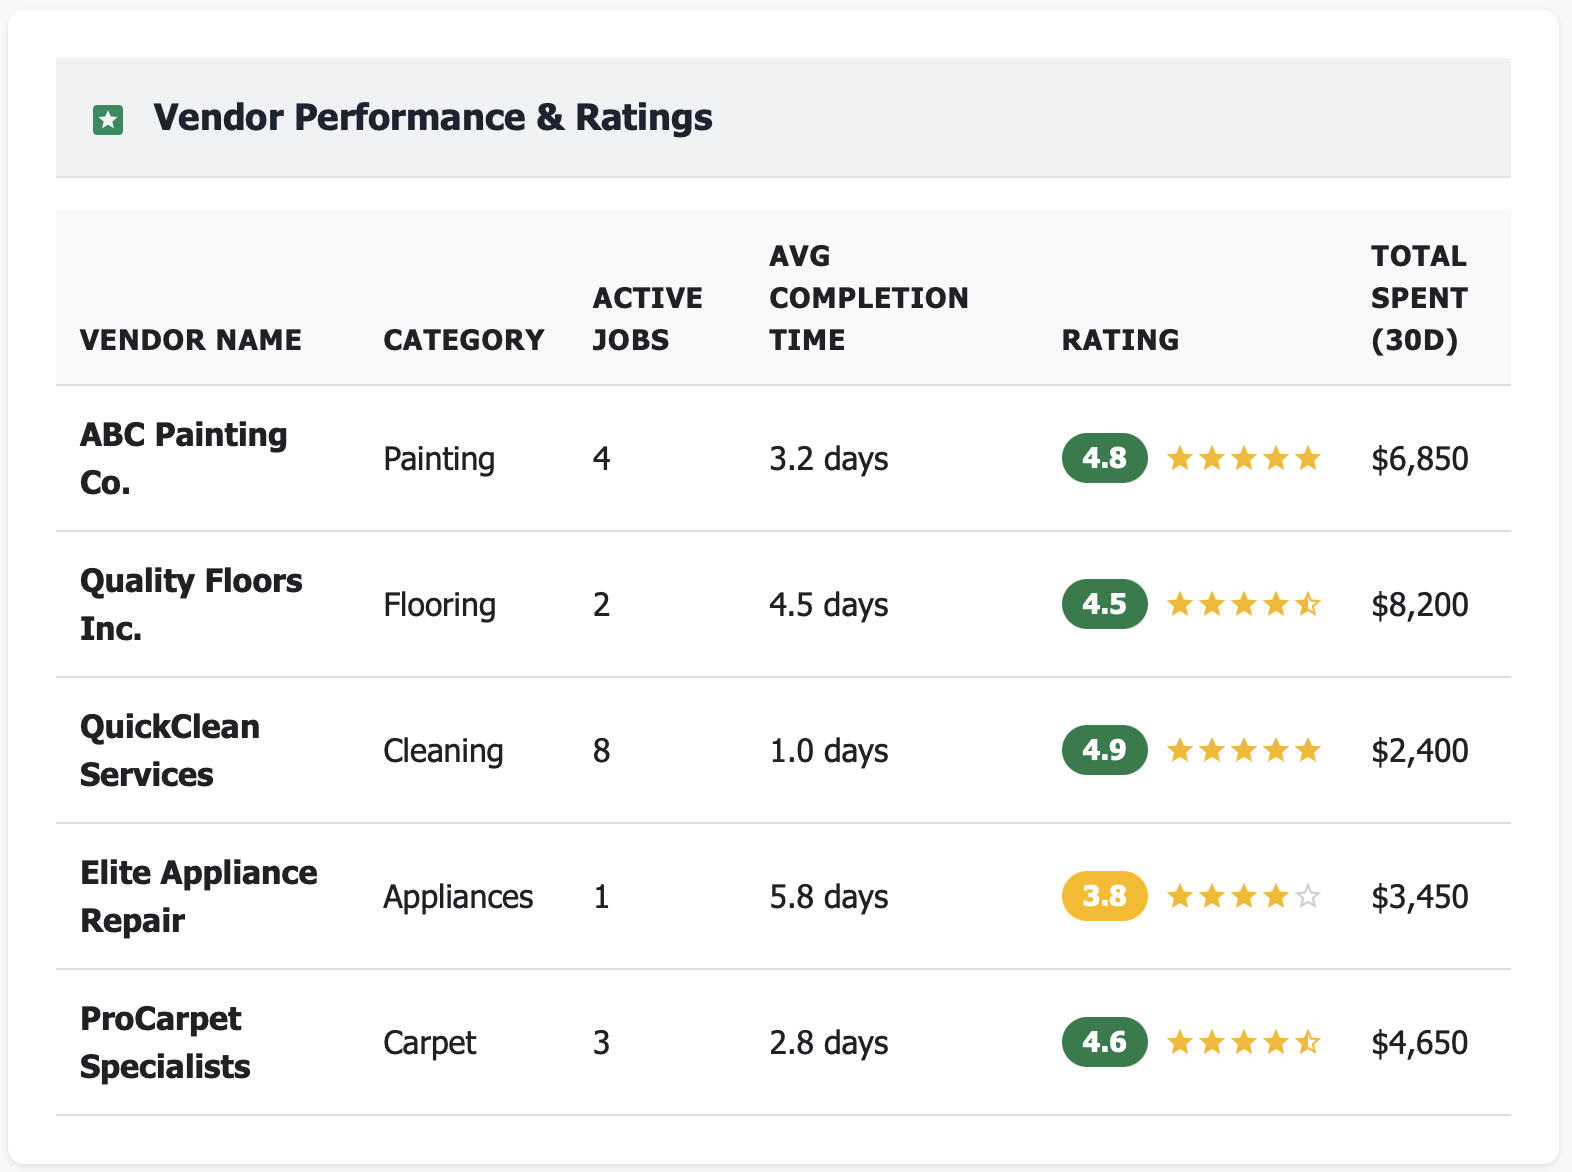
Hold vendors accountable:
ABC Painting: 4.8 stars, 3.2 days avg
Quality Floors: 4.5 stars, 4.5 days avg
QuickClean: 4.9 stars, 1.0 day avg
Elite Appliance: 3.8 stars, 5.8 days (slow!)
Rate, compare, optimize vendor mix
Real Results: From Turn Chaos to Turn Mastery
Metric |
Before Turn Dashboard |
After 6 Months |
|---|---|---|
Average turn time |
18.5 days (unknown variance) |
12.8 days (consistent) |
Turn cost per unit |
$3,450 (unpredictable) |
$2,650 (controlled) |
Turn cost variance |
±45% month-to-month |
±8% month-to-month |
Vendor accountability |
None (manual tracking) |
Rated & performance-tracked |
Notice-to-ready time |
42 days average |
28 days average |
Invoice processing time |
12 days average |
2 days average |
Annual vacancy loss recovered |
— |
$124K across 5 properties |
Features That Transform Turn Operations
📋 Notice-to-Ready Tracking
Track every unit from the moment a resident gives notice through move-out, inspection, work, and lease-ready status. Never lose track of where a unit is in the process.
🏠 Units On Notice
See all upcoming move-outs with days until vacant. Plan turn work before the unit is even empty. Eliminate the “oh no, we need to start the turn NOW” panic.
⏱️ Turn Time Analytics
Average turn time portfolio-wide
Turn time by property
Turn time by unit type
Turn time trends over time
Comparison to target (14 days? 10 days?)
💰 Turn Cost Breakdown
See exactly what each turn costs:
Painting: $950 avg
Flooring: $1,200 avg
Cleaning: $285 avg
Appliances/Other: $415 avg
Know where money goes.
👷 Vendor Performance Monitoring
Active jobs per vendor
Average completion time per vendor
Star ratings and performance scores
Total spend per vendor (30-day rolling)
Identify slow or expensive vendors
🔧 Work Stage Visibility
See which units are at which stage:
Inspection needed
Work scheduled
Painting in progress (75% complete)
Flooring in progress (50% complete)
Final clean in progress (95% complete)
Ready to lease
No more “where’s that unit?” questions.
📊 Turn Stage Pipeline
Funnel view showing how many units are at each stage. Identify bottlenecks. If 15 units are “waiting on inspection,” you have a scheduling problem. If 8 units are in painting, you may need more painting capacity.
💳 Invoice Management
Pending invoices requiring review
Approved invoices
Disputed invoices
Total pending invoice value
Days in review per invoice
Accelerate approvals, improve vendor relationships.
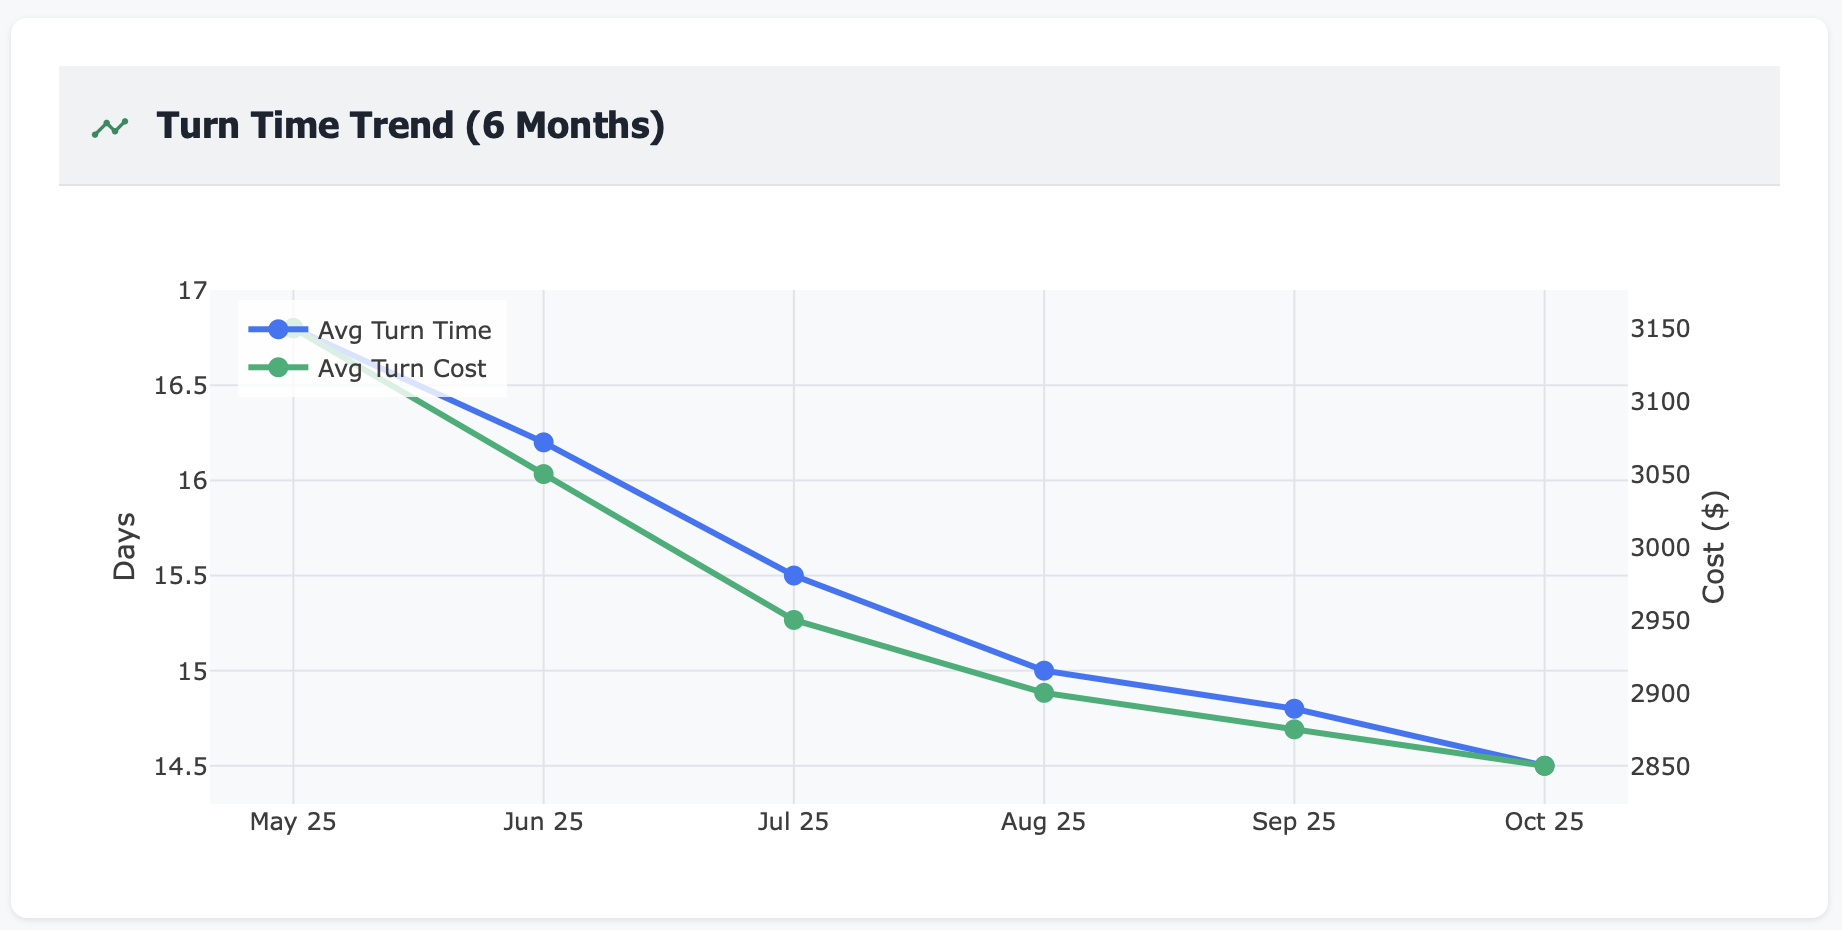
📈 Turn Time Trends
6-month trend showing turn times improving (or worsening). Track the impact of process changes. See seasonal patterns.
🎯 Property Benchmarking
Compare turn performance across all properties. Identify best practices from top performers. Understand why Property A averages 12 days while Property B averages 18 days.
Perfect For
Property Managers
Manage daily turn operations with complete visibility, reduce vacancy loss, and ensure consistent turn quality across all units
Maintenance Supervisors
Coordinate vendor schedules, track work progress, manage invoices, and optimize turn times through better process management
Regional/Portfolio Managers
Benchmark turn performance across properties, identify inefficiencies, standardize best practices, and control turnover costs at scale
Use Case: Cutting Turn Time from 18 to 12 Days
Real Customer Story
Challenge: A 5-property, 850-unit portfolio had inconsistent turn times ranging from 12-24 days, with no visibility into why. Turn costs were unpredictable, and vendor management was chaos.
Dashboard Revealed:
Portfolio average turn time: 18.5 days (vs 14-day target)
Parkview Estates: 22 days average (worst performer)
Harbor View: 12.5 days average (best performer)
Turn cost variance: ±45% month-to-month
Vendor performance: Elite Appliance taking 5.8 days vs 2-3 day standard
Bottleneck: 40% of delay was “waiting on inspection” (scheduling problem)
Invoice processing: 12 days average (causing vendor frustration)
No standardized turn process across properties
Action Taken:
Inspection scheduling: Pre-scheduled inspections for all units on notice (eliminated “waiting on inspection” bottleneck)
Vendor optimization: Replaced slow appliance vendor, standardized painting and flooring vendors across portfolio
Process standardization: Documented Harbor View’s 12-day process, rolled out to all properties
Turn cost budgets: Set $2,800 target per turn, required approval for overages
Invoice acceleration: Implemented 48-hour review target for all turn invoices
Work stage tracking: Required vendors to update status daily via mobile app
Parkview Estates focus: Deep-dive into why turns took 22 days, fixed staffing and process issues
Results After 12 Months:
Portfolio average turn time: 12.8 days (down from 18.5)
Parkview Estates: 14.2 days (down from 22 days, 35% improvement)
Turn cost: \(2,650 average (down from \)3,450, 23% reduction)
Turn cost variance: ±8% (down from ±45%, predictable budgeting)
Vendor accountability: All vendors rated, slow performers replaced
Invoice processing: 2 days average (down from 12 days)
Vacancy loss recovered: 5.7 days per turn × 180 turns/year × \(65/day = **\)66,700 annually**
Turn cost savings: \(800 per turn \times 180 turns = **\)144K annually**
Total impact: $210K+ annual improvement
“We knew turns were slow, but had no idea where the time was going. The dashboard showed us exactly where to focus.” — Regional Maintenance Supervisor
Key Turn Metrics You’ll Track
Technical Integration (Works With Your Stack)
Frequently Asked Questions
Q: Can vendors update work status themselves? A: Yes. Vendors can use a mobile app or simple web interface to update work stage and completion. This keeps the dashboard current without manual data entry.
Q: How do you calculate turn time? A: Move-out date to lease-ready date. You can also track “notice-to-ready” time if you want to include the notice period.
Q: Can I set different turn time targets by property or unit type? A: Yes. Set property-specific or unit-type-specific targets (e.g., 12 days for 1BR, 16 days for 3BR).
Q: What if we do turns in-house vs. using vendors? A: Works for both. Track in-house staff as “vendors” or track by work stage regardless of who does the work.
Q: Can I see turn costs in real-time? A: Yes, as invoices are entered or approved. You’ll see total turn cost for each unit as work progresses.
Q: Does this replace our work order system? A: No. Your team still uses their existing tools. The dashboard aggregates and analyzes that data for better turn management and accountability.
Stop Losing Money to Slow Turns
Every day without turn visibility means:
Units sitting vacant longer than necessary
Vendor delays going unnoticed
Turn costs drifting higher with no accountability
Properties operating inefficiently while you’re unaware
Revenue loss that compounds month after month
Your best-performing properties have turn times under 14 days through disciplined process management.
The question isn’t whether you need turn intelligence.
The question is: How much are slow turns costing you right now?
Related Topics
Ready to Get Started?
Schedule a personalized demo to see this dashboard in action.
Schedule Demo Contact Sales