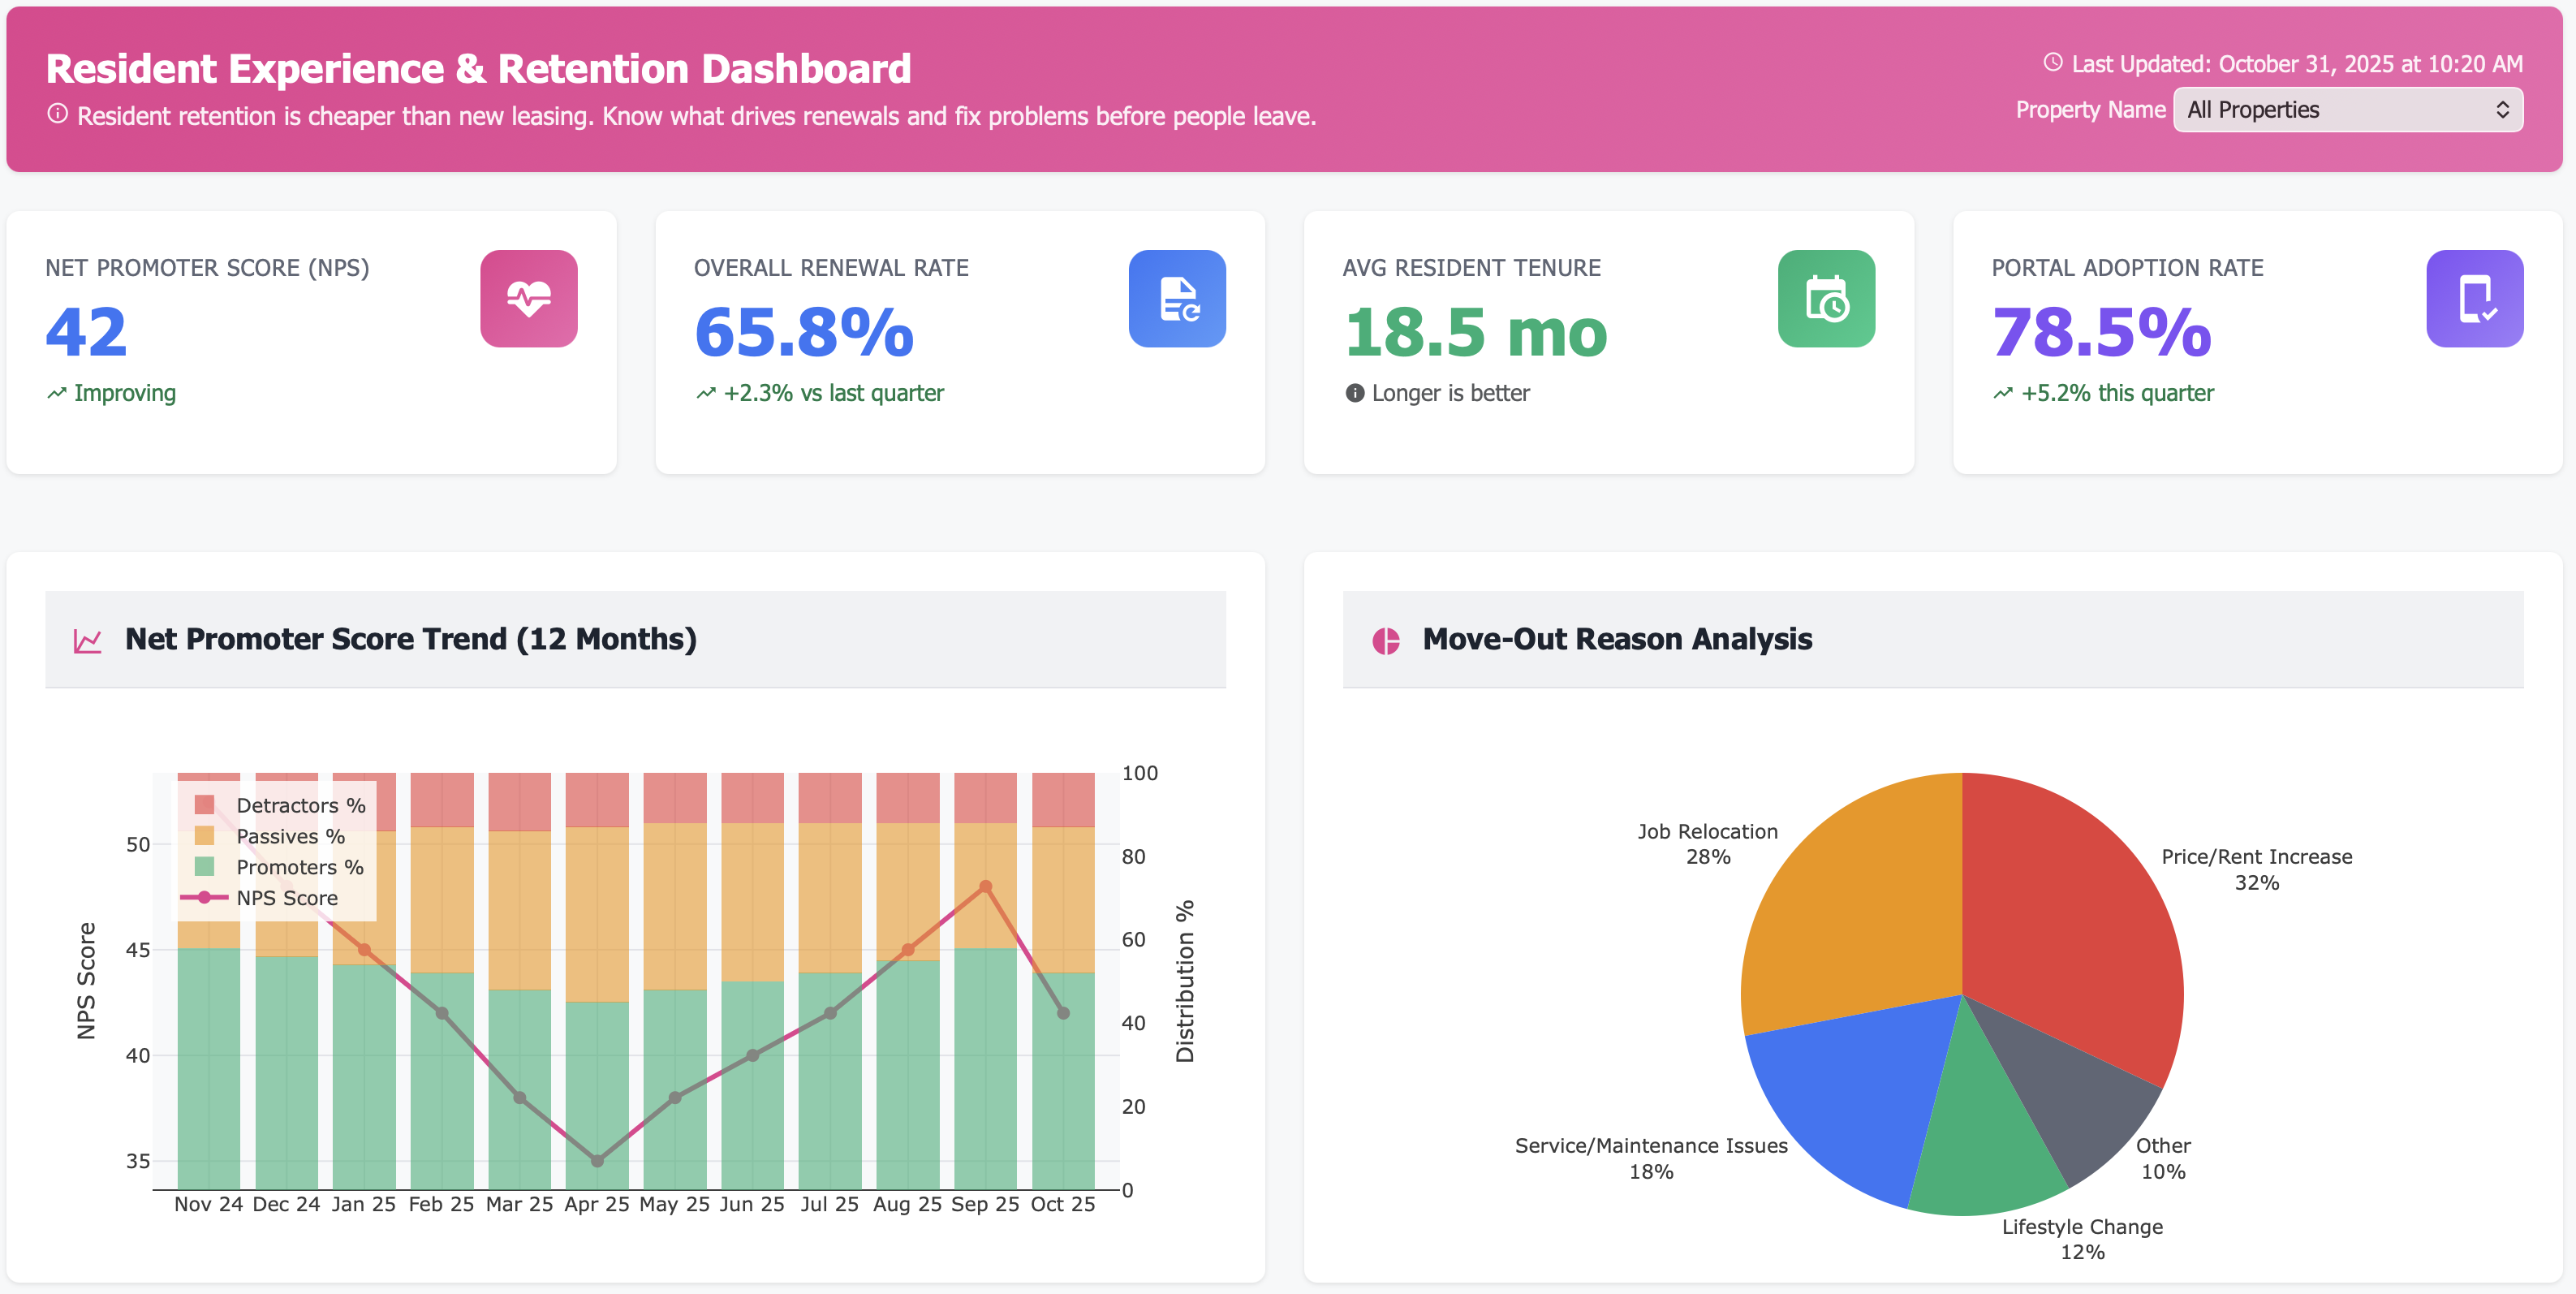
Residents Experience and Retention Dashboard
Track renewal rates by cohort and segment, understand why residents leave (controllable vs. uncontrollable), calculate lifetime value to focus high-ROI retention efforts, and measure which communications actually drive renewals. Most portfolios improve renewal rates 5-10 percentage points, protecting $500K-$1M+ annually per 500 units.
Getting Started
1️⃣ Connect Your Property Management System Link your PM system to import resident data—lease terms, move-in dates, payment history, maintenance requests. This creates your baseline retention metrics.
2️⃣ Import Historical Move-Out Data Upload 2-3 years of historical move-outs with reasons (if available). Even incomplete data helps establish patterns and benchmarks.
3️⃣ Define Your Segments Work with us to define your resident segments based on your portfolio—families, young professionals, students, luxury vs affordable, etc.
4️⃣ Calculate Baseline Metrics The system calculates your current renewal rates by segment, average LTV, and identifies move-out reason patterns from historical data.
5️⃣ Deploy Early Warning System The ML model begins scoring residents on renewal likelihood. Start with the at-risk, high-value residents for your first retention interventions.
6️⃣ Optimize Over Time Month one: See your retention landscape. Quarter one: Test segmented renewal offers. Quarter two: Measure impact of early interventions. Year one: Systematic retention strategy across portfolio.
Turn Resident Churn into Resident Loyalty: Retention Intelligence That Protects Revenue
Track renewal rates by cohort, lease term, and resident segment. Know which groups renew at 75% vs. 45%—intervene before notices arrive, not after.
Categorize every move-out reason. See patterns: 32% cite rent increases, 18% maintenance issues, 12% job relocations. Fix what you can control, accept what you can’t.
Calculate lifetime value by segment. Some residents are worth \(45K over 4 years, others \)18K over 18 months. Allocate retention efforts where ROI is highest.
The Retention Problem Bleeding Your Revenue
If you’re managing resident relationships across properties, these blindspots are costing you thousands per lost lease:
⚠️ Renewal rate mystery: Portfolio average is 62%, but you don’t know which cohorts renew at 75% vs. 45%—can’t fix what you can’t see
⚠️ Move-out reason guesswork: Exit surveys say “other” or sit incomplete—no systematic understanding of why residents leave
⚠️ Spray-and-pray retention: Sending same renewal offers to everyone—wasting concessions on residents who’d stay anyway
⚠️ High-value churn: Your best residents (pay on time, renew repeatedly, cause zero issues) leave, but you had no warning signals
⚠️ Communication ineffectiveness: Sending 40 emails per year, but which ones drive renewals? Which are ignored? No idea.
⚠️ Segment blindness: Not tracking that young professionals renew at 72% while families renew at 85%—missing segment-specific strategies
⚠️ Late intervention: Residents decide to leave 60-90 days before giving notice—you engage 30 days out, far too late
⚠️ No lifetime value tracking: Treating all residents equally when some are 3x more valuable than others
Every 1% improvement in renewal rate = \(125K-\)250K annual value on a 500-unit property. Time to get scientific about retention.
Your New Reality: Data-Driven Retention Strategy
Renewal Rate by Cohort & Segment
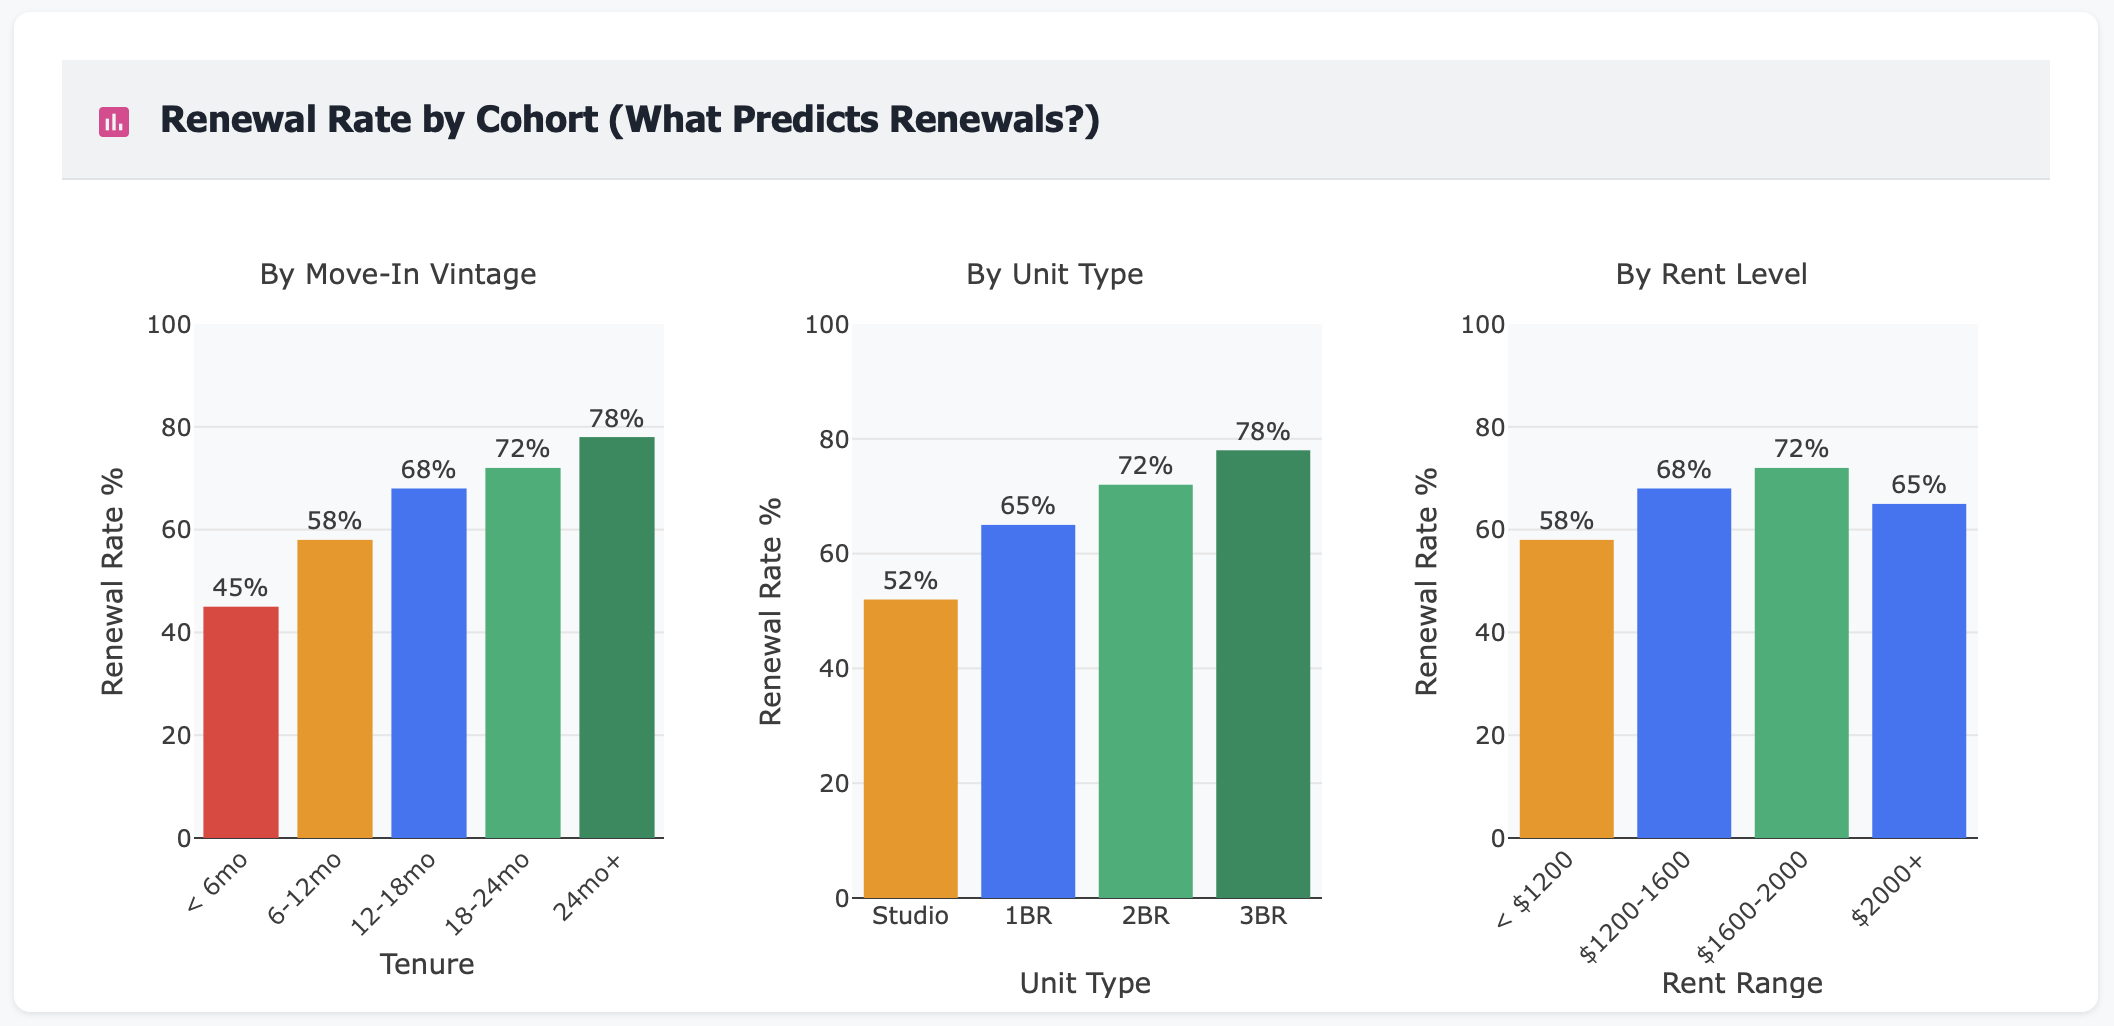
Know who stays and who goes:
Young Professionals (22-32): 68% renewal rate
Families with Kids: 84% renewal rate (highest!)
Empty Nesters (55+): 79% renewal rate
Students/Interns: 41% renewal rate (expected)
First-time renters: 58% renewal rate
Returning residents: 89% renewal rate (gold!)
Target your efforts where they matter most
Move-Out Reason Analysis
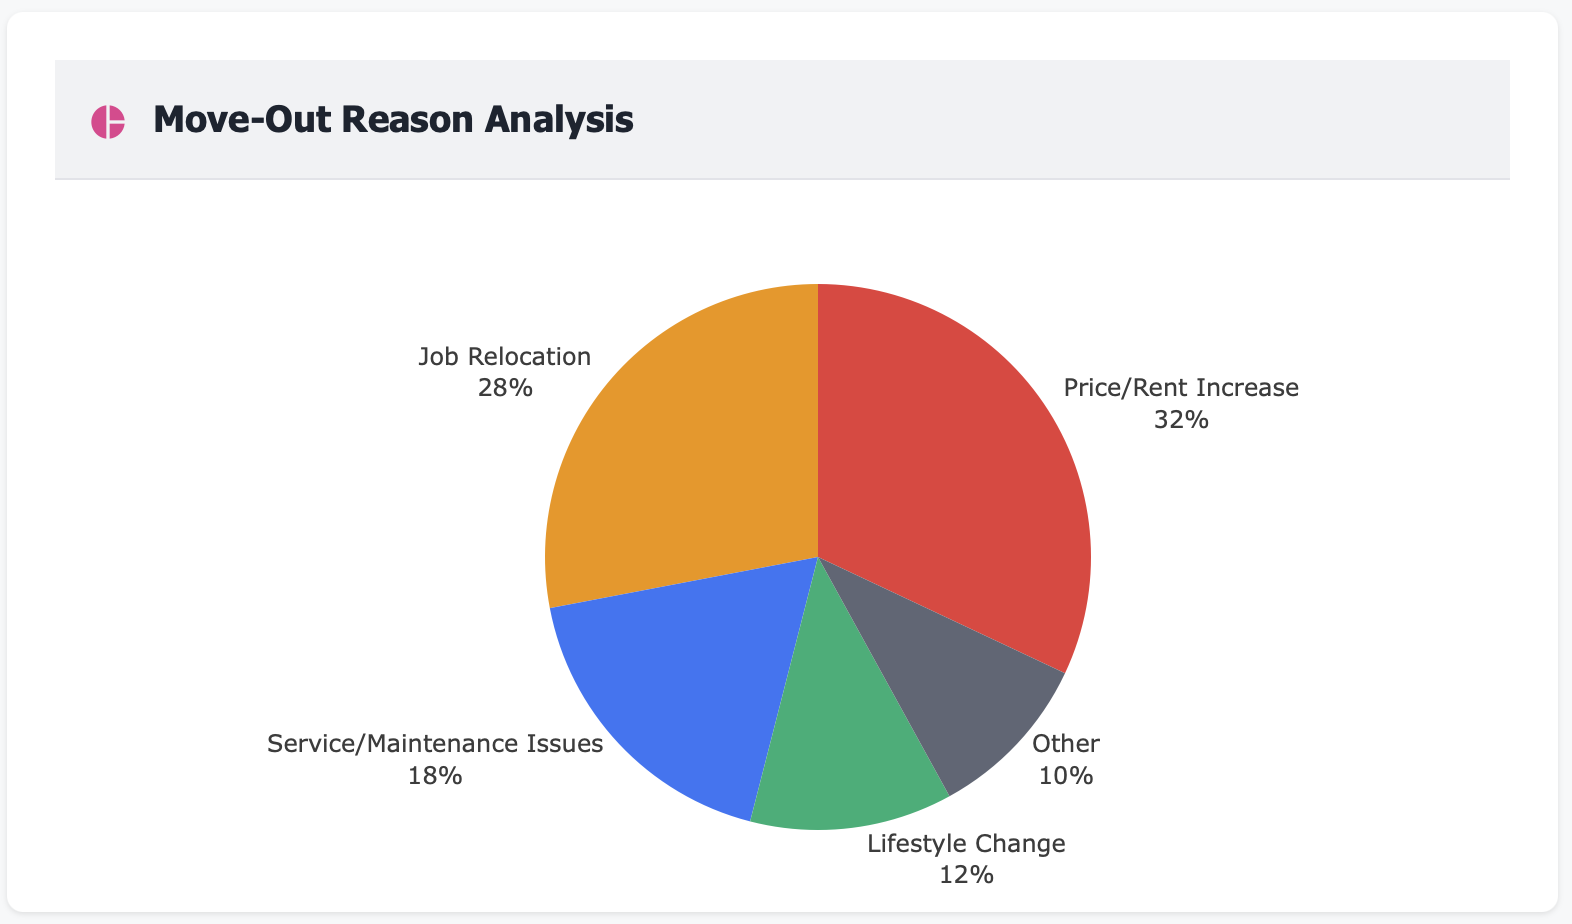
Understand the controllable vs. uncontrollable:
Rent increase too high: 32% (controllable!)
Maintenance/quality issues: 18% (controllable!)
Job relocation: 15% (uncontrollable)
Buying a home: 12% (uncontrollable)
Roommate changes: 8% (partly controllable)
Poor management experience: 7% (controllable!)
Other/Unknown: 8%
Fix what drives 57% of preventable move-outs
Lifetime Value by Resident Segment
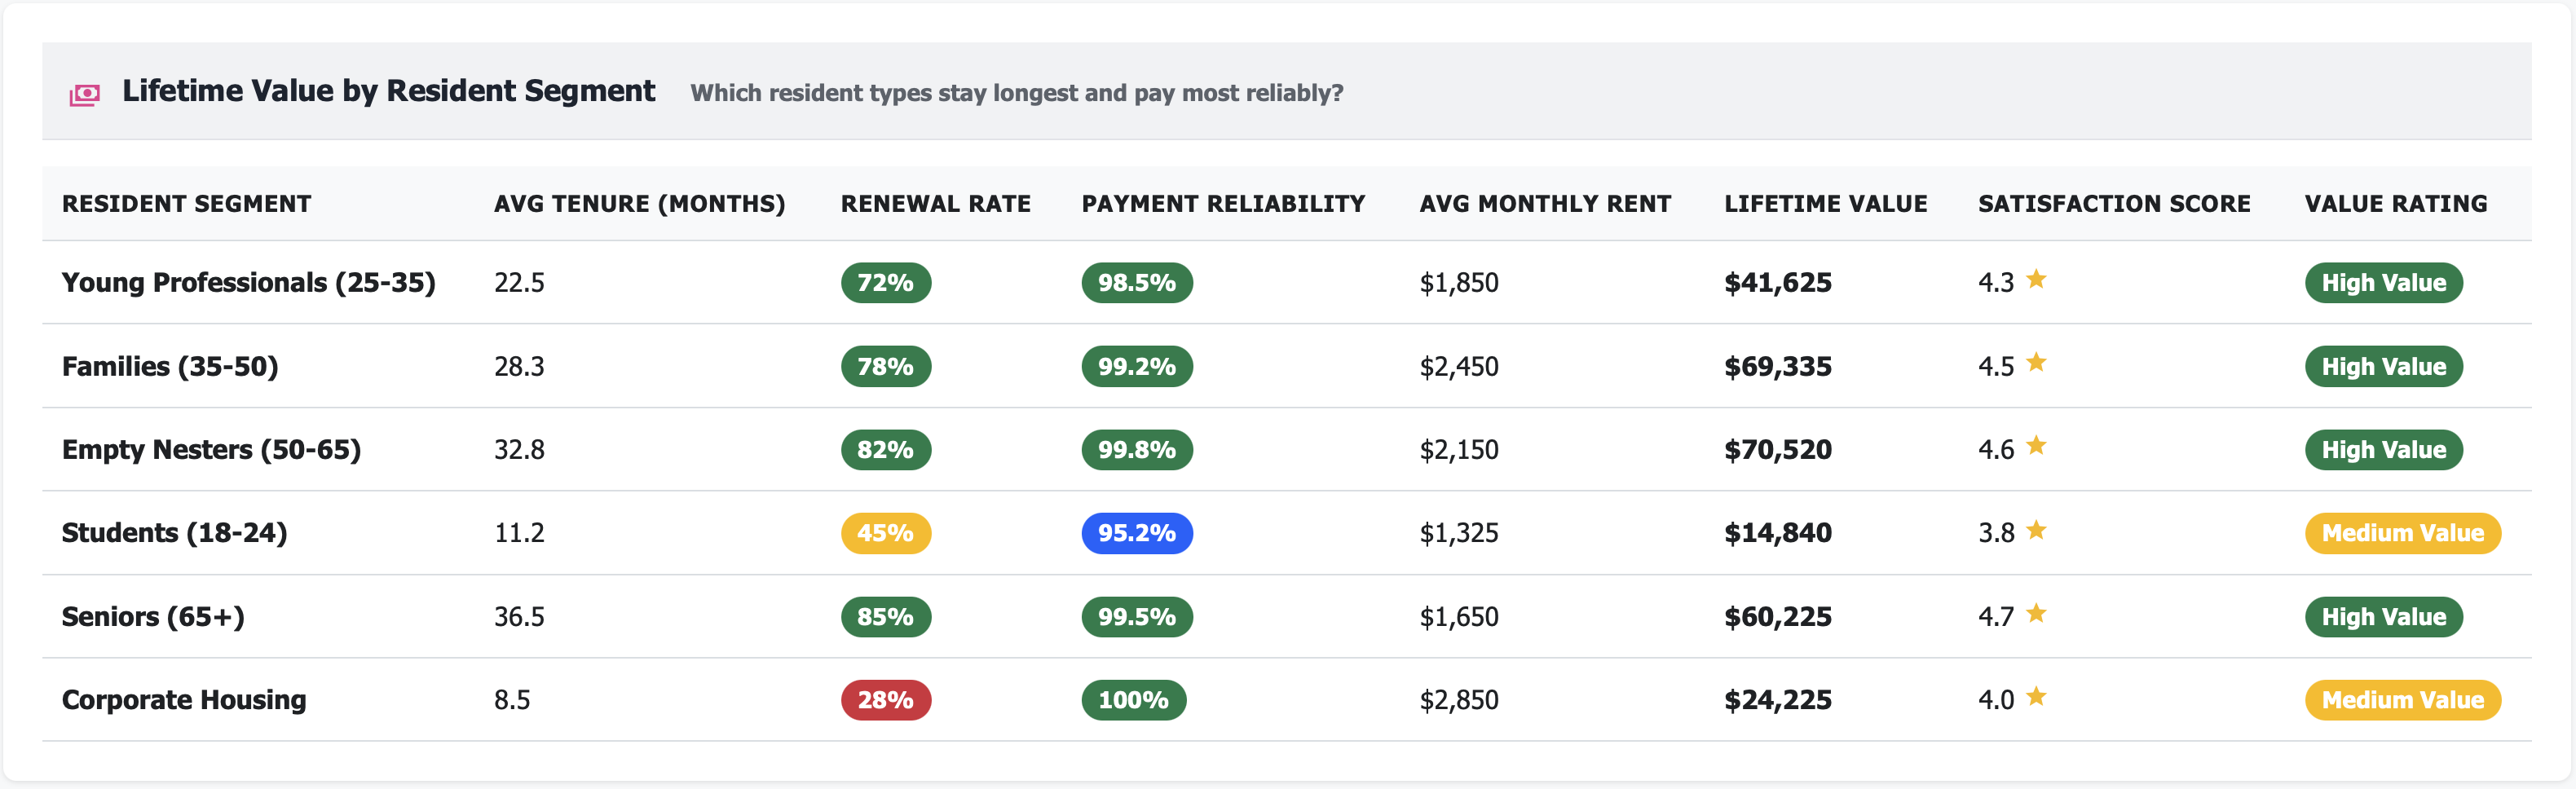
Focus retention where ROI is highest:
Long-term families: $52,500 LTV (4.2 years avg stay)
Empty nesters: $48,200 LTV (3.8 years avg stay)
Young professionals: $31,800 LTV (2.4 years avg stay)
First-time renters: $24,600 LTV (1.9 years avg stay)
Students: $16,200 LTV (1.2 years avg stay)
Not all residents are created equal
Real Results: From Churn Acceptance to Retention Mastery
Metric |
Before Retention Intelligence |
After 12 Months |
|---|---|---|
Portfolio renewal rate |
62% (industry average) |
71% (top quartile) |
High-value segment retention |
68% (untracked) |
82% (targeted efforts) |
Controllable move-outs |
35% (unidentified) |
18% (addressed issues) |
Renewal offer effectiveness |
Unknown (spray-and-pray) |
3.2x ROI (data-driven) |
Early warning interventions |
0% (reactive only) |
24% (proactive outreach) |
Communication engagement |
18% open rate (average) |
42% open rate (segmented) |
Time to renewal decision |
8 days before expiry (panic) |
45 days before expiry (planned) |
Annual revenue protected |
— |
$875K across 500-unit portfolio |
Features That Transform Resident Retention
📊 Renewal Rate Tracking by Cohort
See renewal rates broken down by:
Move-in cohort (2023 vs 2024 vs 2025)
Resident segment (families, young professionals, empty nesters)
Lease term (12-month vs 15-month)
Rent level (market rate vs affordable vs luxury)
Property and unit type
Identify patterns, optimize strategy.
📝 Move-Out Reason Categorization
Systematically categorize every move-out:
Rent-related (increase too high, found cheaper, etc.)
Quality issues (maintenance, cleanliness, noise)
Life changes (relocation, home purchase, family size)
Management issues (service quality, policies, staff)
Competitive pressure (better amenities elsewhere)
Track trends over time. See if maintenance move-outs spike after deferred capex decisions.
💎 Lifetime Value Calculation
Calculate LTV for each resident segment based on:
Average length of stay (historical data)
Average monthly rent
Renewal probability
Payment reliability (late fees, NSF)
Maintenance cost burden
Target high-LTV segments with premium retention offers.
📈 Renewal Likelihood Scoring
ML model assigns each resident a renewal likelihood score (0-100) based on:
Time in property (longer = more likely)
Payment history (on-time = more likely)
Maintenance request volume (high volume = less likely)
Communication engagement (high engagement = more likely)
Segment characteristics
Prioritize outreach to at-risk, high-value residents.
📧 Communication Effectiveness Tracking
Track which communications drive renewals:
Email open rates by message type
Click-through rates on renewal offers
Response rates to surveys
Engagement with community events
Portal login frequency
Double down on what works, eliminate what doesn’t.
🎯 Segment-Specific Retention Strategies
Create targeted retention playbooks by segment:
Families: Emphasize school stability, community, safety
Young professionals: Emphasize amenities, location, flexibility
Empty nesters: Emphasize quiet, low-maintenance, service
Students: Emphasize price, roommate matching, short terms
Personalize at scale.
⚠️ Early Warning System
Identify at-risk residents 60-90 days before lease end:
Low engagement scores (haven’t logged into portal in 90 days)
High maintenance volume (4+ requests in last 60 days)
Payment struggles (2+ late payments)
Negative survey responses
Segment + cohort risk factors
Intervene early, before they mentally check out.
📊 Renewal Offer Optimization
Track effectiveness of different renewal offers:
Rent increase scenarios (0%, 2%, 5%, 8%)
Concession types (free month, reduced deposit, free parking)
Lease term incentives (15-month vs 12-month)
Upgrade offers (move to better unit at same price)
Find the optimal offer for each segment.
🏆 High-Value Resident Identification
Flag residents worth extra retention effort:
Long tenure (3+ years)
On-time payment history (100%)
Low maintenance burden
High engagement scores
Referral source (brought other residents)
Roll out red carpet for your best residents.
📉 Churn Risk Dashboard
For each property, see:
Current month’s non-renewal notices (8 notices, $18K monthly revenue loss)
Next 60 days expiring leases (45 leases, $98K at risk)
At-risk residents (12 high-value residents flagged)
Intervention pipeline (6 conversations scheduled)
Manage retention like a sales pipeline.
💬 Exit Interview Capture & Analysis
Digitize exit interviews:
Structured questions with categorized responses
Sentiment analysis on open-ended feedback
Trend tracking (are rent complaints increasing?)
Property-level patterns (one property has 3x maintenance complaints)
Learn from losses, improve operations.
📅 Retention Calendar
See upcoming retention milestones:
Residents approaching renewal window (next 30/60/90 days)
Scheduled retention conversations
Renewal offer deadlines
Move-out dates for non-renewals
Never miss a retention opportunity.
Perfect For
Property Managers
Reduce churn through data-driven retention strategies, prioritize high-value residents, and hit renewal rate targets consistently across properties
Regional/Portfolio Managers
Benchmark retention performance across properties, identify best practices from top performers, and scale successful strategies portfolio-wide
VPs of Operations
Understand portfolio-wide retention trends, allocate resources to highest-ROI initiatives, and protect revenue through improved resident lifetime value
Use Case: From 62% to 71% Renewal Rate ($875K Value Created)
Real Customer Story
Challenge: A 500-unit, 3-property portfolio had a 62% renewal rate (industry average) but no systematic retention strategy. Move-out reasons were poorly tracked, renewal offers were identical for all residents, and high-value residents churned at the same rate as everyone else. Leadership knew retention was important but had no data to guide strategy.
Dashboard Revealed:
Portfolio renewal rate: 62% (300 annual move-outs)
Renewal rate variance: 48% (Property C) to 71% (Property A)—why?
Segment analysis: Families renewed at 79%, young professionals at 58%
Move-out reasons: 35% cited controllable factors (rent, maintenance, service)
High-value residents (3+ years, perfect payment): Only 68% retention (should be 85%+)
Renewal offer effectiveness: Giving same 3% rent increase to everyone
Communication engagement: 18% email open rate (poor)
Early warning: 0% of at-risk residents identified before giving notice
Exit interview completion: 23% (low, missing data)
LTV by segment: Not calculated—treating all residents equally
Action Taken:
Segment identification: Categorized all 500 residents into 6 segments (families, young professionals, empty nesters, students, first-time renters, long-term residents)
LTV calculation: Calculated lifetime value for each segment—families worth \(52K, students worth \)16K
High-value resident flagging: Identified 85 high-value residents (long tenure, perfect payment, low maintenance) for premium retention treatment
Move-out reason standardization: Implemented required exit interview with categorized reasons (rent, maintenance, relocation, etc.)
Early warning system: Deployed ML model scoring all residents on renewal likelihood 90 days before expiration
Segmented renewal offers: Created different offer strategies by segment—families got stability messaging + small increases, young professionals got flexibility + amenity upgrades
Proactive outreach program: Property managers reached out to at-risk, high-value residents 60-75 days before expiration (not 30 days)
Communication optimization: Segmented email campaigns by resident type, tested subject lines and content
Controllable churn reduction: Focused on the 35% of move-outs citing rent increases, maintenance, or service issues
Property C deep-dive: Investigated why Property C had 48% renewal rate—found aggressive rent increases (8-10%) and slow maintenance response times
Results After 12 Months:
Portfolio renewal rate: 71% (up from 62%, 9 percentage points!)
Renewal rate improvement = 45 additional renewals annually
High-value resident retention: 82% (up from 68%, 14 points)
Property C renewal rate: 64% (up from 48%, 16 points—after rent increase moderation and maintenance staffing)
Controllable move-outs: 18% (down from 35%, addressed root causes)
Communication engagement: 42% open rate (up from 18%, segmented content)
Early warning interventions: 72 at-risk residents contacted early, 28 retained (39% save rate)
Exit interview completion: 91% (up from 23%, now required process)
Renewal offer ROI: 3.2x (gave smaller increases to high-value segments, saved concession costs)
Annual move-outs: 255 (down from 300, 45 fewer)
Value per retained resident: \(2,850 in turnover costs + \)1,200 in vacancy loss = $4,050
Total value created: 45 retained residents × \(4,050 = \)182K turnover savings
Additional revenue from higher occupancy: 45 units × 60 days faster occupancy × \(35/day = \)94.5K
Revenue protected from better renewal rates: 45 renewals × \(1,450/mo \times 12 months = \)783K annualized
Total annual impact: $875K+ value created
“We thought 62% was just the reality of our market. The data showed us exactly where we were leaving money on the table—and how to get it back.” — Regional Property Manager
Key Retention Metrics You’ll Track
Technical Integration (Works With Your Stack)
Frequently Asked Questions
Q: How do you calculate lifetime value for residents? A: LTV = (Average monthly rent × Average length of stay × Renewal probability) - (Turnover costs + Maintenance burden). We use your historical data to calculate segment-specific LTV.
Q: What if we don’t have historical move-out reasons tracked? A: Start fresh. Implement structured exit interviews today. Within 3-6 months you’ll have enough data to see patterns. We can also use industry benchmarks as a starting point.
Q: How accurate is the renewal likelihood scoring? A: ML models trained on 12-24 months of your property data typically achieve 75-82% accuracy in predicting non-renewals 90 days ahead. Accuracy improves over time as the model learns your portfolio.
Q: Can I create custom resident segments? A: Yes. Define segments based on any criteria—move-in year, rent level, unit type, number of occupants, payment method, referral source, etc.
Q: How do I know if an early intervention worked? A: The system tracks which at-risk residents received outreach, what was offered, and whether they renewed. Compare save rates for contacted vs. non-contacted at-risk residents.
Q: What if renewal rates vary widely by property? A: Perfect use case. The dashboard shows property-level benchmarks. Identify what top performers do differently (pricing strategy, service quality, communication style) and replicate across portfolio.
Q: Can I track communication effectiveness across channels? A: Yes. Track email open rates, portal login frequency, text message responses, in-person event attendance—any channel you use to communicate with residents.
Q: How do I balance rent increases with retention? A: The dashboard shows renewal rate sensitivity to rent increase levels by segment. Test 0%, 2%, 5%, 8% increases and see which maximizes revenue (accounting for both rent growth and retention).
Stop Accepting Churn as Inevitable
Every month without retention intelligence means:
Losing high-value residents you could have saved with early intervention
Wasting concessions on residents who’d renew anyway
Treating all residents equally when some are 3x more valuable than others
Not understanding why residents leave—repeating the same mistakes
Missing the 60-90 day window when residents mentally decide to stay or go
Sending communications that don’t resonate and don’t drive renewals
Every 1 percentage point improvement in renewal rate = \(125K-\)250K annually on a 500-unit property.
The question isn’t whether you need retention intelligence.
The question is: How many residents are you losing that you could have kept?
Related Topics
Ready to Get Started?
Schedule a personalized demo to see this dashboard in action.
Schedule Demo Contact Sales