Rent & Revenue Intelligence Dashboard
Stop guessing at rent pricing. Know exactly what each unit should rent for, eliminate loss to lease, and capture $50K-200K+ in hidden revenue. Track market positioning, lease expirations, renewal rates, and concession costs—all in one intelligent dashboard that pays for itself in weeks.
Getting Started
1️⃣ Connect Your Systems Link your PMS and market data sources. We handle the technical integration. Takes about 30 minutes of your time.
2️⃣ Historical Data Import We pull in 12-24 months of historical rent and revenue data. This creates your baseline and enables trend analysis immediately.
3️⃣ Start Optimizing Day one: See your loss to lease, market position, and expiration risk. Week one: Make your first data-driven pricing adjustments.
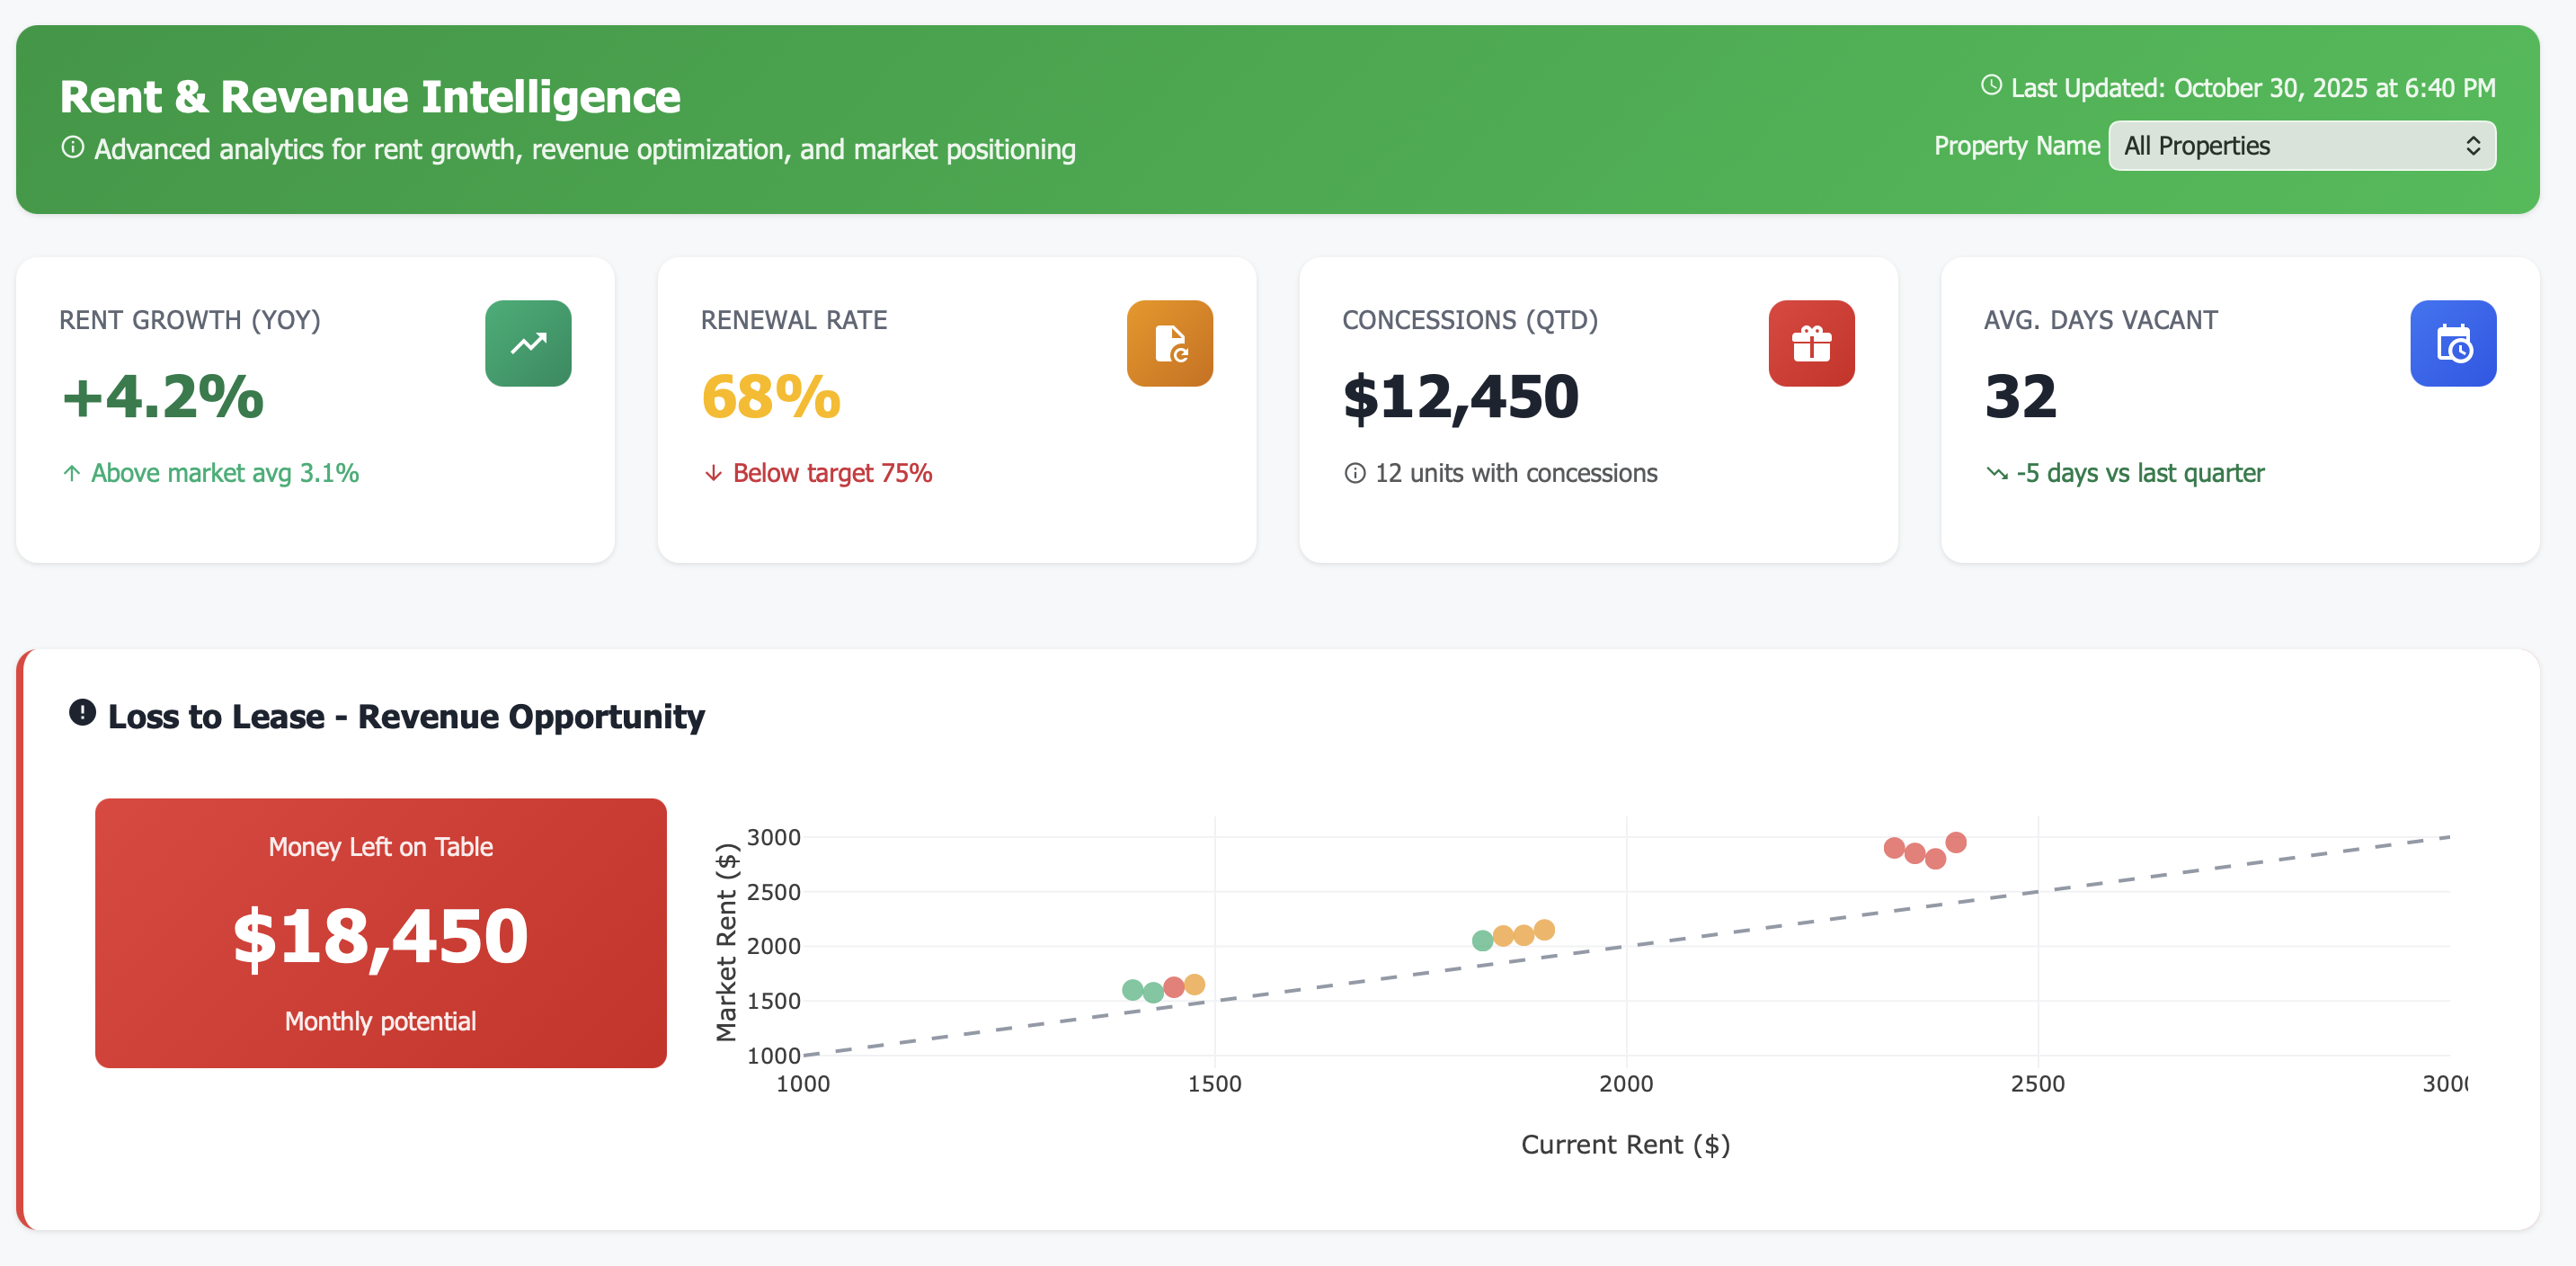
Stop Leaving Money on the Table: Rent & Revenue Intelligence
Stop guessing at rent pricing. Know exactly what each unit should rent for based on real-time market data and your portfolio’s performance.
Instantly see where you’re under-market, over-market, or losing money to concessions. Capture every dollar your properties can generate.
Anticipate lease expirations, predict renewal rates, and plan revenue 12 months ahead—no more budget surprises.
The Revenue Problem Costing You Thousands
If you’re a revenue manager or asset manager, you’re probably dealing with:
🔴 Pricing in the dark: Setting rents based on last year’s numbers or “gut feel”
🔴 Loss to lease bleeding: Units sitting $50-200 below market rate, month after month
🔴 Concession chaos: Giving away $20K+ in specials without tracking true cost
🔴 Renewal surprises: Discovering massive lease expirations too late to plan
🔴 Market disconnect: No idea if you’re competitive until tours drop off
Every month of mispricing = thousands in lost revenue. Let’s fix that.
Your New Reality: Revenue Intelligence at Your Fingertips
Average Rent Trends by Unit Type
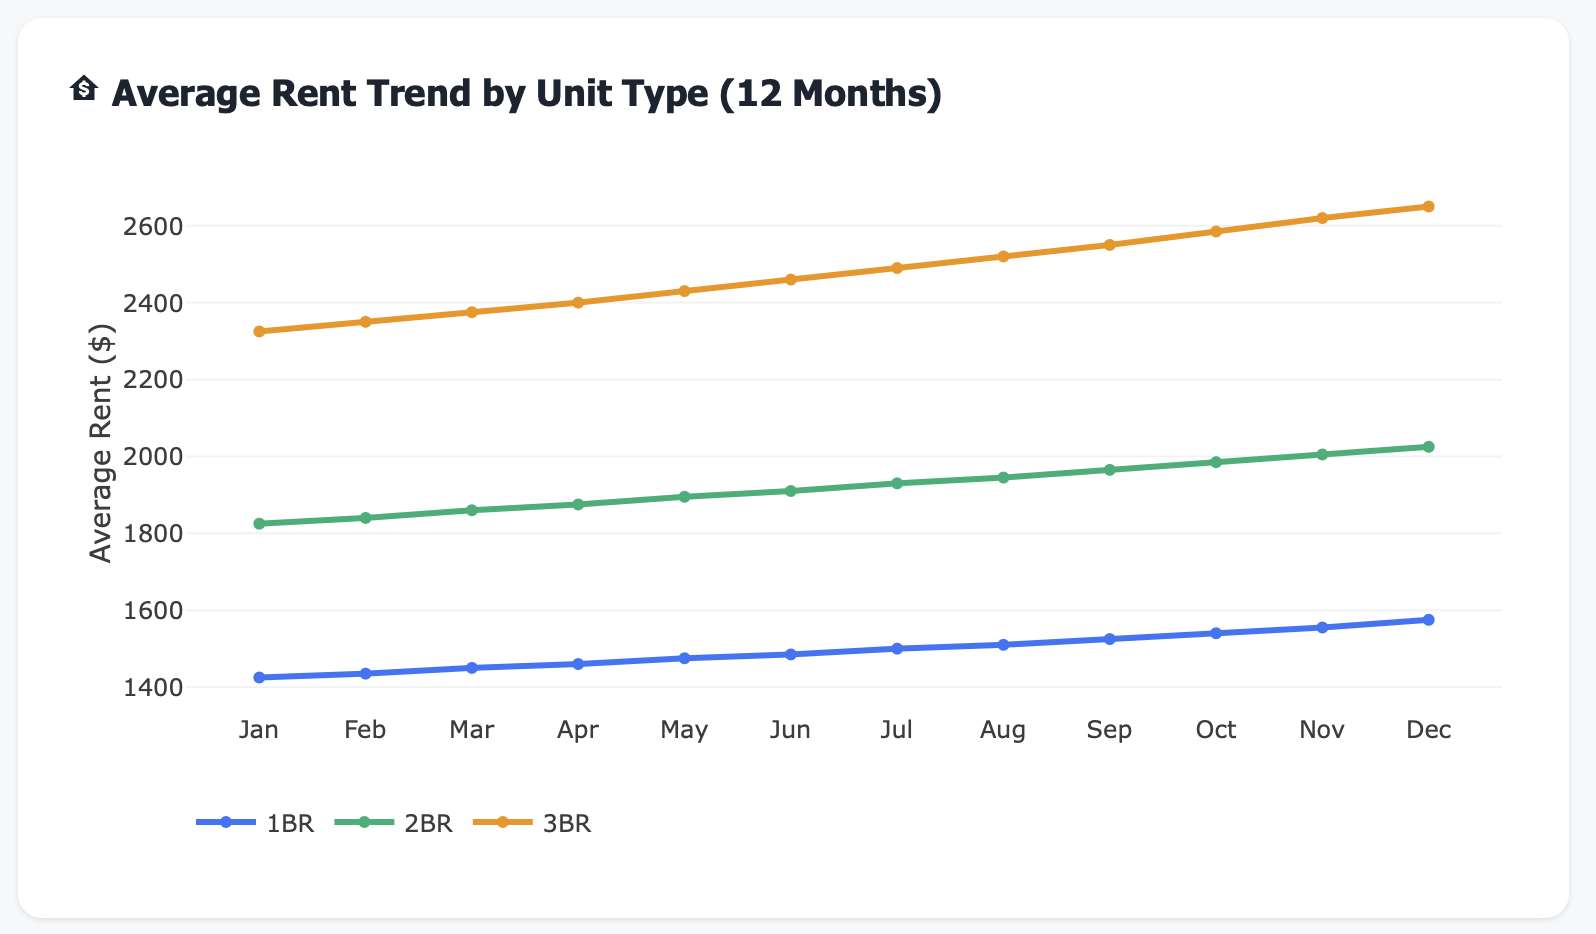
Track rent performance over time:
1BR, 2BR, 3BR trends on one chart
12-month rolling view
Seasonal pattern identification
Growth trajectory visualization
Spot opportunities before your competitors do
Market Rent vs Actual Rent Analysis
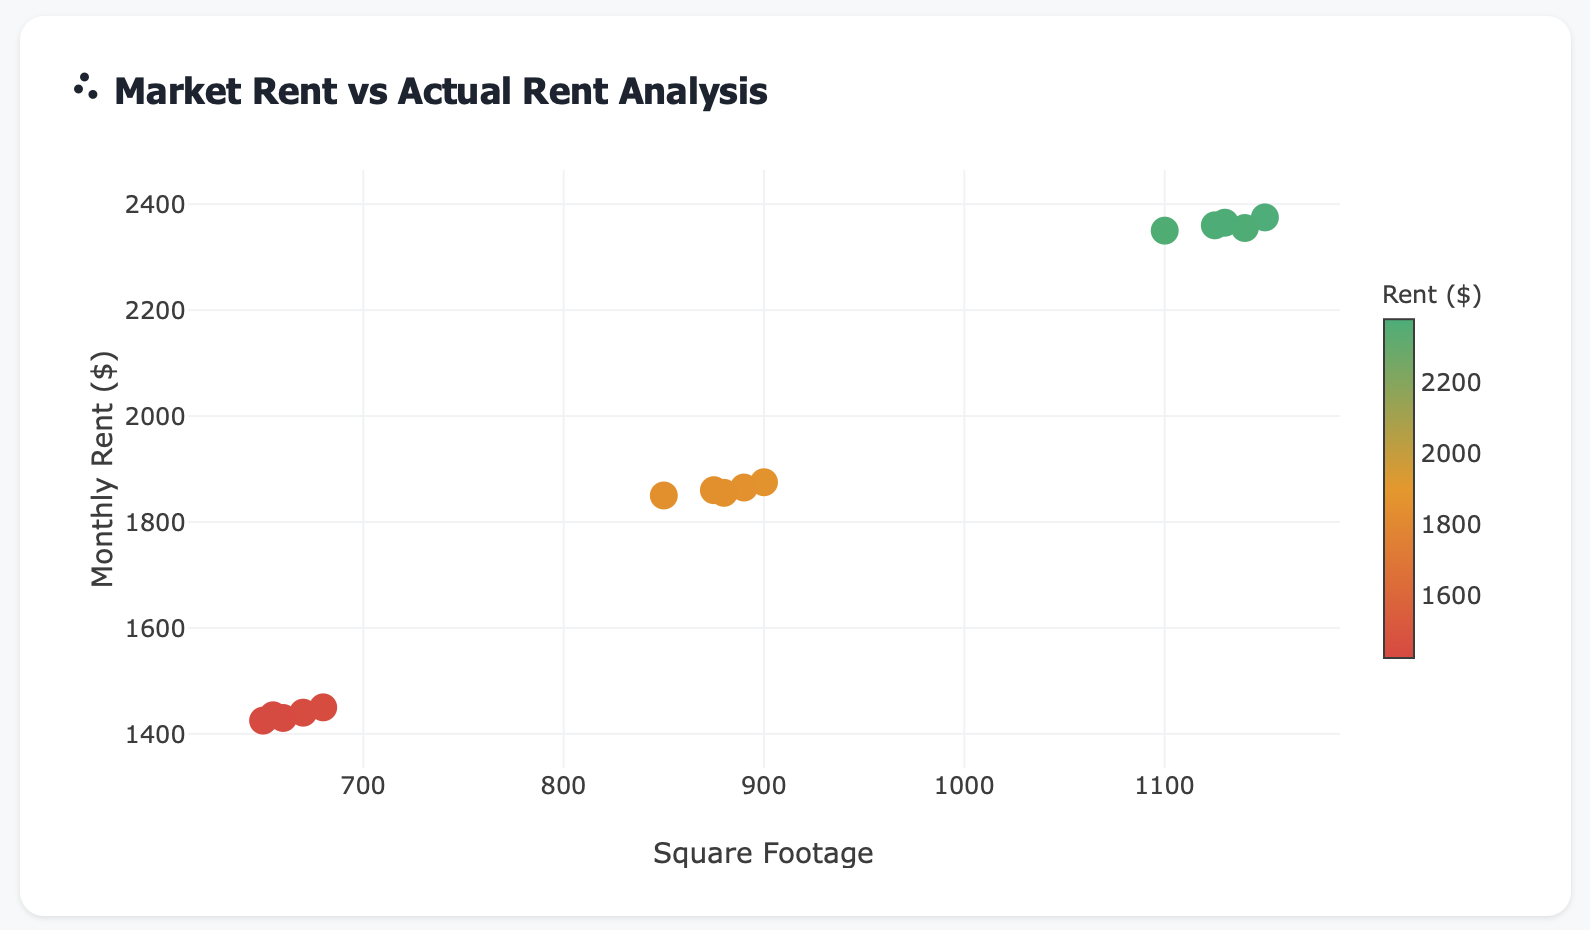
Instantly identify:
Units priced below market (money left on table)
Units priced above market (lease-up risk)
Optimal pricing sweet spots
Immediate adjustment opportunities
Color-coded alerts for quick action
Lease Expiration Trends
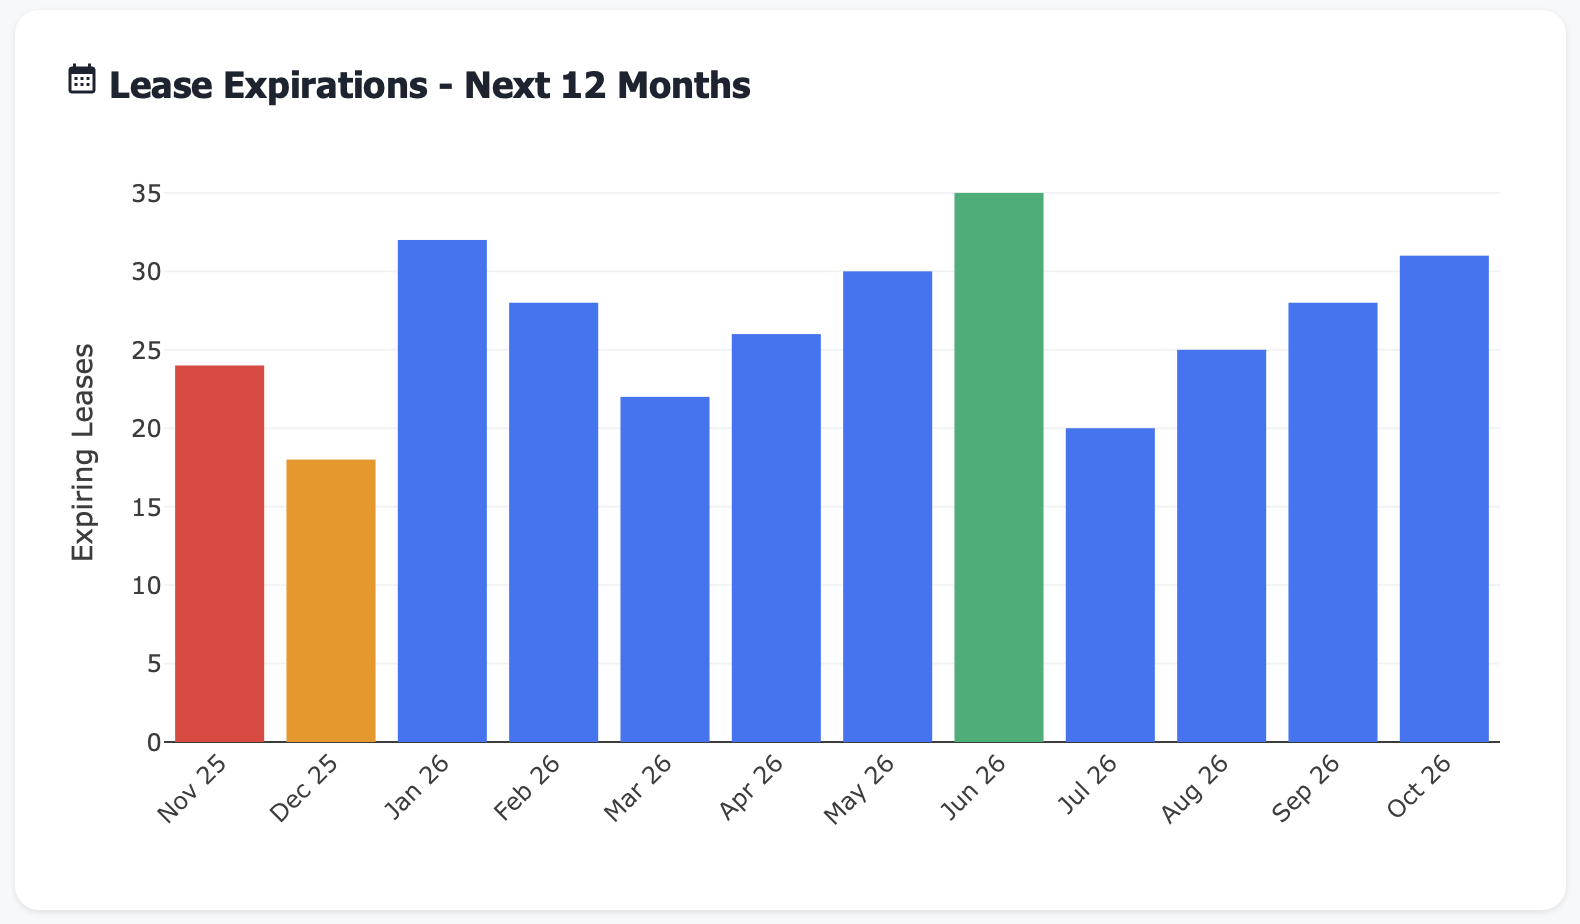
Plan ahead with clarity:
Monthly expiration volumes
Peak renewal periods
Revenue risk windows
Strategic renewal timing
Never get caught off guard by an expiration wave
Real Results: Revenue Transformation
Metric |
Before Revenue Dashboard |
After 6 Months |
|---|---|---|
Loss to lease |
$87K annually (unknown) |
$22K annually (78% reduction) |
Time spent on rent analysis |
8 hours/week |
1 hour/week |
Renewal acceptance rate |
52% |
64% |
Concession tracking |
Excel chaos |
Real-time visibility |
Revenue forecast accuracy |
±15% variance |
±3% variance |
Average rent growth |
2.1% YoY |
4.8% YoY |
Features That Maximize Revenue
📈 Rent Growth Year-Over-Year Tracking
See exactly how your rents are growing (or not). Big, bold percentage with up/down arrows. Compare to market benchmarks. Know if you’re keeping pace or falling behind.
🎯 Lease Renewal Rate Gauge
Visual gauge showing your renewal acceptance rate. Set targets and watch performance. Identify which properties or unit types struggle with renewals. Correlate pricing with retention.
💸 Loss to Lease Calculator
The number that matters most. See exactly how much money you’re leaving on the table by pricing below market. Breaks down by property and unit type. Updates daily as market rates shift.
🎁 Concessions Cost Tracker
Total dollars given away in concessions this quarter. Track by concession type (free rent, reduced deposit, waived fees). See which properties rely most heavily on specials. Calculate true effective rent.
⏱️ Vacant Unit Days on Market
Average time from vacant to leased. Trend indicator shows if you’re improving. Compare across properties. Identify if pricing is slowing lease-up velocity.
💰 Revenue Variance Analysis
Budgeted vs actual revenue with detailed breakdown:
Rental income variance
Fee income performance
Other income tracking
Line-item accountability
📏 Rent Per Square Foot Comparison
Compare properties on an apples-to-apples basis. Bar chart shows which properties command premium pricing. Identify underperformers. Justify capital improvements.
Perfect For
Revenue Managers
Optimize pricing across your entire portfolio with data-driven insights that increase NOI by 10-15% annually
Asset Managers
Maximize property value through strategic rent optimization and proactive renewal management
Property Owners
Understand exactly where revenue is strong, where it’s weak, and what actions to take to improve performance
Key Revenue Metrics at a Glance
Technical Integration (Seamless Setup)
Frequently Asked Questions
Q: How accurate is the market rent data? A: We integrate with CoStar, RealPage, and other authoritative sources. You can also manually input local comp data for hyper-accuracy.
Q: Can I set custom pricing rules? A: Yes. Set floor/ceiling rents, adjustment limits, approval workflows, and automated recommendations based on your strategy.
Q: What if I don’t have a revenue manager? A: Perfect use case! The dashboard makes sophisticated revenue management accessible to property managers without specialized training.
Q: How often does data update? A: Your choice: Real-time sync (for supported PMS systems) or daily batch updates. Market data typically refreshes weekly.
Q: Can I export reports for ownership? A: Absolutely. One-click exports to PDF, Excel, or PowerPoint. Schedule automated monthly reports to stakeholders.
Q: Does this work for affordable housing? A: Yes, with modifications. We can adapt the dashboard for rent-restricted properties, though loss-to-lease calculations work differently.
Don’t Let Another Month of Revenue Slip Away
Every day without revenue intelligence is money left on the table. Your competitors are using data. Your market is moving. Your residents are shopping around.
The question isn’t whether you can afford this dashboard.
The question is: How much are you losing without it?
Related Topics
Ready to Get Started?
Schedule a personalized demo to see this dashboard in action.
Schedule Demo Contact Sales