Profit & Loss Statement
For any business owner, knowing whether the business is profitable is essential. This dashboard tells you exactly that. With impeccable design, this will keep you informed.
Getting Started
1️⃣ Connect Your Accounting System Link your QuickBooks, Xero, or other accounting platform to pull income and expense data automatically. This establishes your P&L baseline.
2️⃣ Import Historical Data Upload 12-24 months of historical P&L data. This shows trends, seasonal patterns, and establishes margin baselines for comparison.
3️⃣ Set Your Budget Enter annual budget by income source and expense category. This enables budget variance tracking and alerts.
4️⃣ Configure Alerts Set up alerts for: margin below target, expenses over budget, revenue decline, or client concentration exceeding thresholds.
5️⃣ Train Your Team Train CFO, CEO, and department managers on the dashboard—how to read P&L trends, interpret variances, and take corrective action.
6️⃣ Start Improving Week one: Identify biggest expense overruns. Month one: Implement cost controls. Quarter one: Improve margins by 2-3 percentage points.
Know Your Numbers in Real-Time: P&L Intelligence That Powers Smart Business Decisions
Track income, expenses, and net margin in real-time. Know if you’re profitable this month—not 30 days after month-end when it’s too late to course-correct.
See which expense categories are growing faster than revenue. Catch a 15% increase in dues & subscriptions before it becomes a 6-month problem costing you $50K.
See which clients drive 80% of revenue. Know if you’re too dependent on one client, or if consulting income is declining while enterprise revenue grows.
The P&L Blindness Costing You Profits
If you’re running a services business without real-time P&L visibility, these gaps are silently eroding margins:
⚠️ Month-end surprise: Learning you lost money this month 30 days later—when you can’t do anything about it
⚠️ Expense creep: Subscriptions, dues, and overhead growing 10-15% annually while revenue stays flat
⚠️ Client concentration risk: Not knowing that 67% of revenue comes from one client until they threaten to leave
⚠️ Category blindness: Salaries up 8% year-over-year, but you didn’t realize because it happened gradually
⚠️ Margin erosion: Net margin declining from 8% to -1.2% over 6 months—noticed too late to prevent
⚠️ Budget variance chaos: No idea if you’re tracking to budget until quarterly review
⚠️ Revenue mix shifts: Consulting income down 30%, but you didn’t notice because total revenue held steady
⚠️ Fixed cost burden: Rent, insurance, and fixed expenses consuming 25% of revenue—is that normal?
For a $1M revenue business, a 5% margin swing = $50K profit difference. Time to see your numbers clearly.
Your New Reality: Complete P&L Visibility
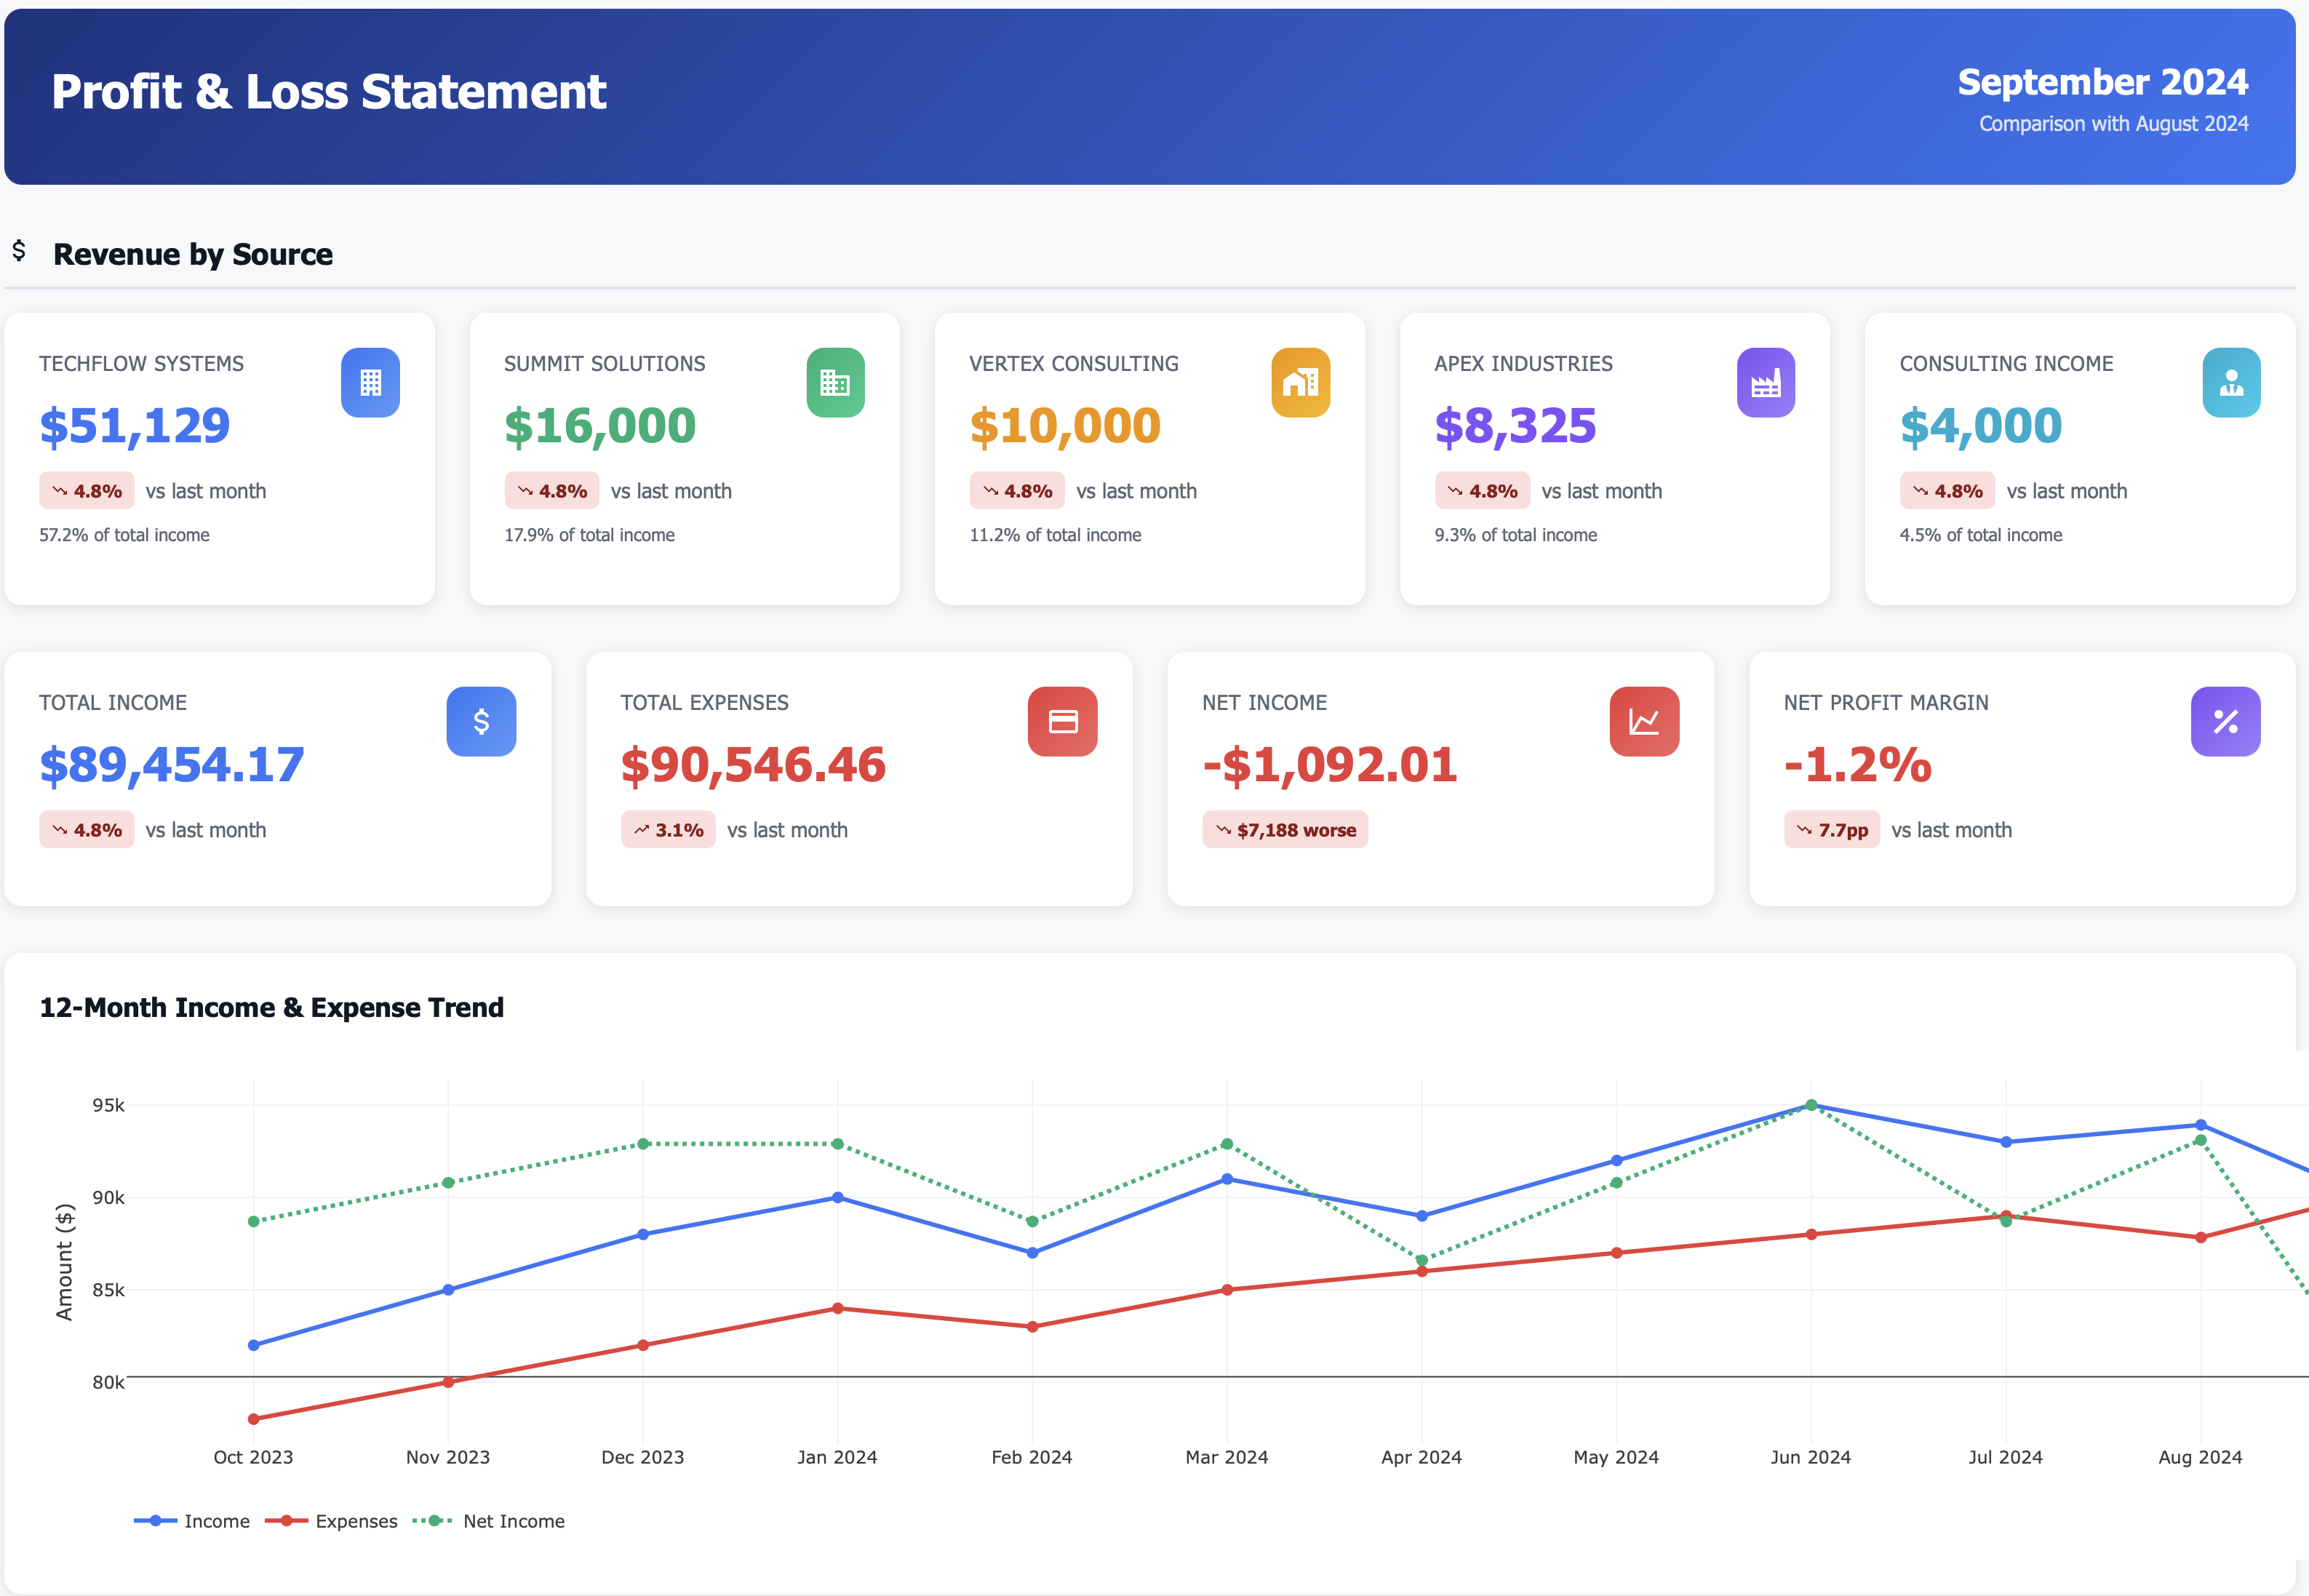
Monthly P&L Summary
Know your position instantly:
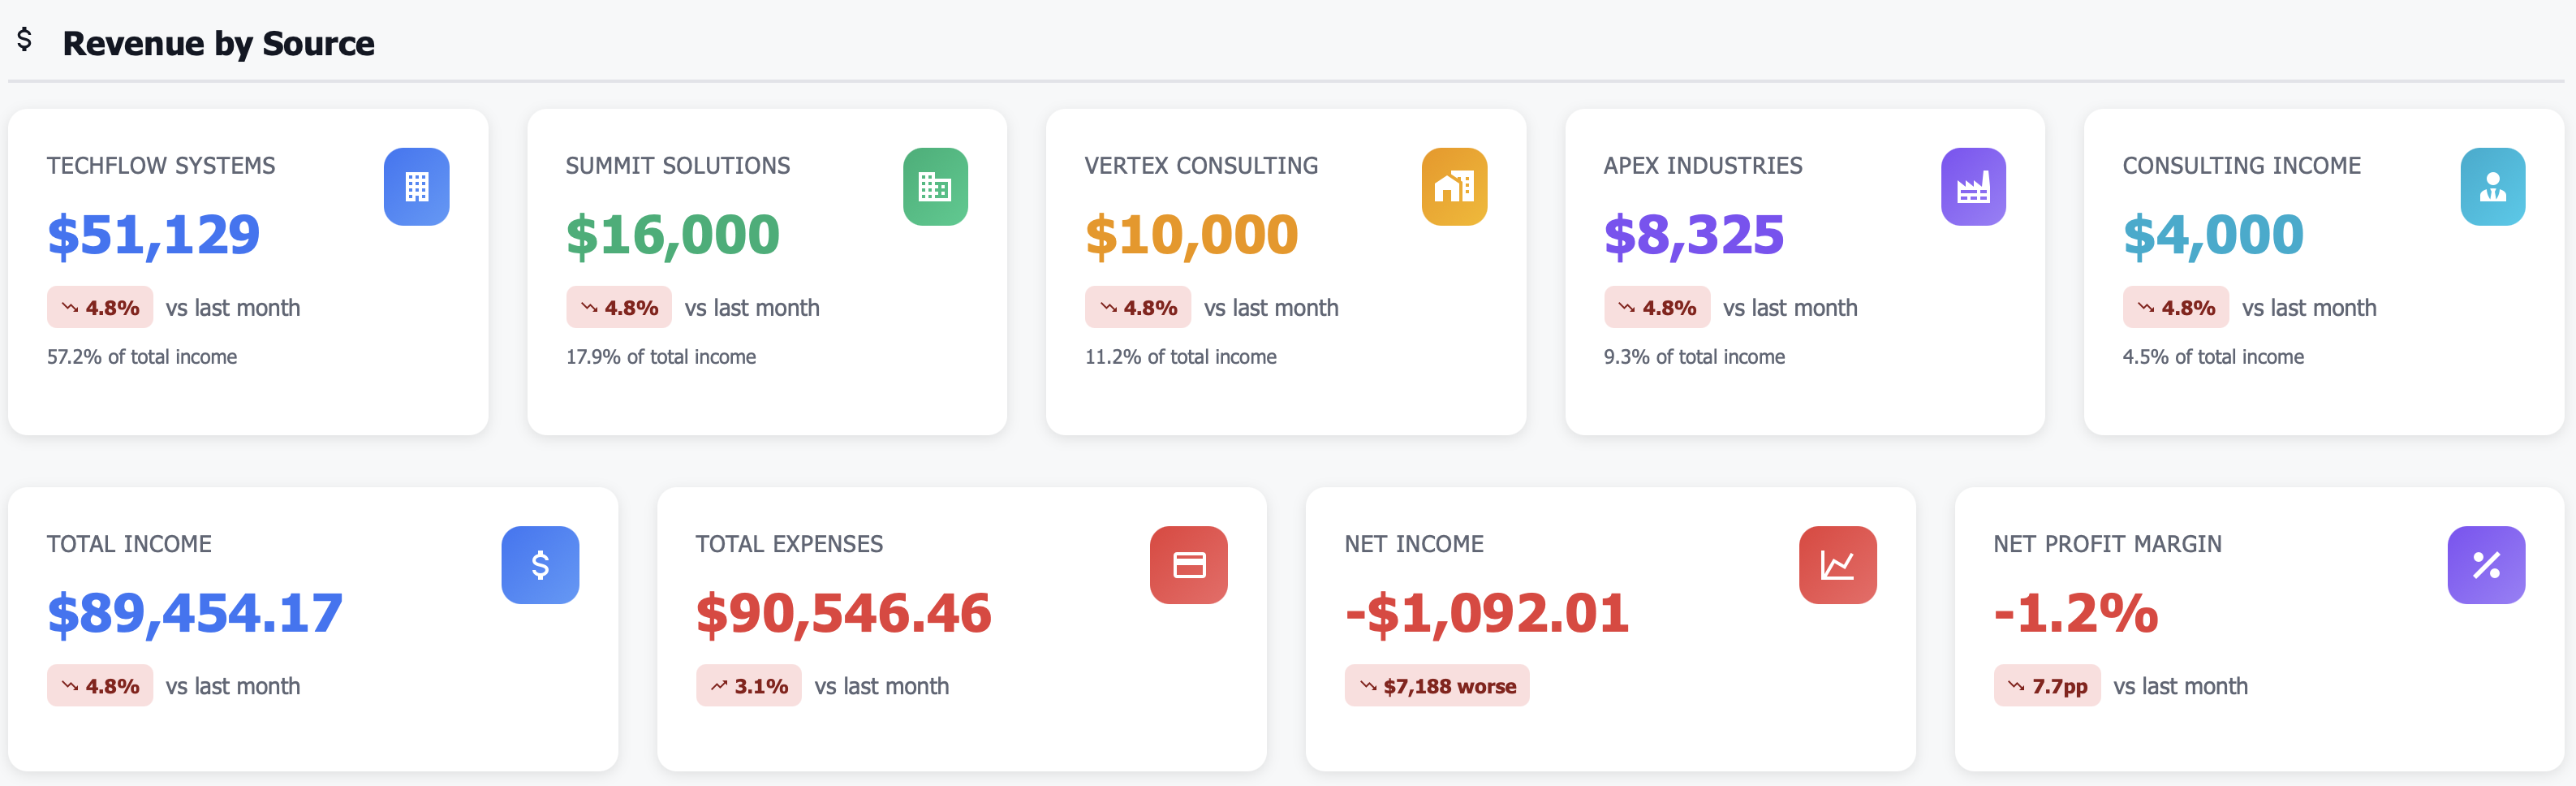
Total Income: $89,454 (down 4.7% from prior month)
Total Expenses: $90,546 (up 3.1% from prior month)
Net Income: -$1,092 (margin: -1.2%)
Prior Month: +$6,096 profit (margin: 6.5%)
Action trigger: Income down + expenses up = immediate margin squeeze requiring attention
Revenue by Client Mix
Risk assessment: 67% revenue from one client = high concentration risk, diversification needed
Expense Breakdown by Category
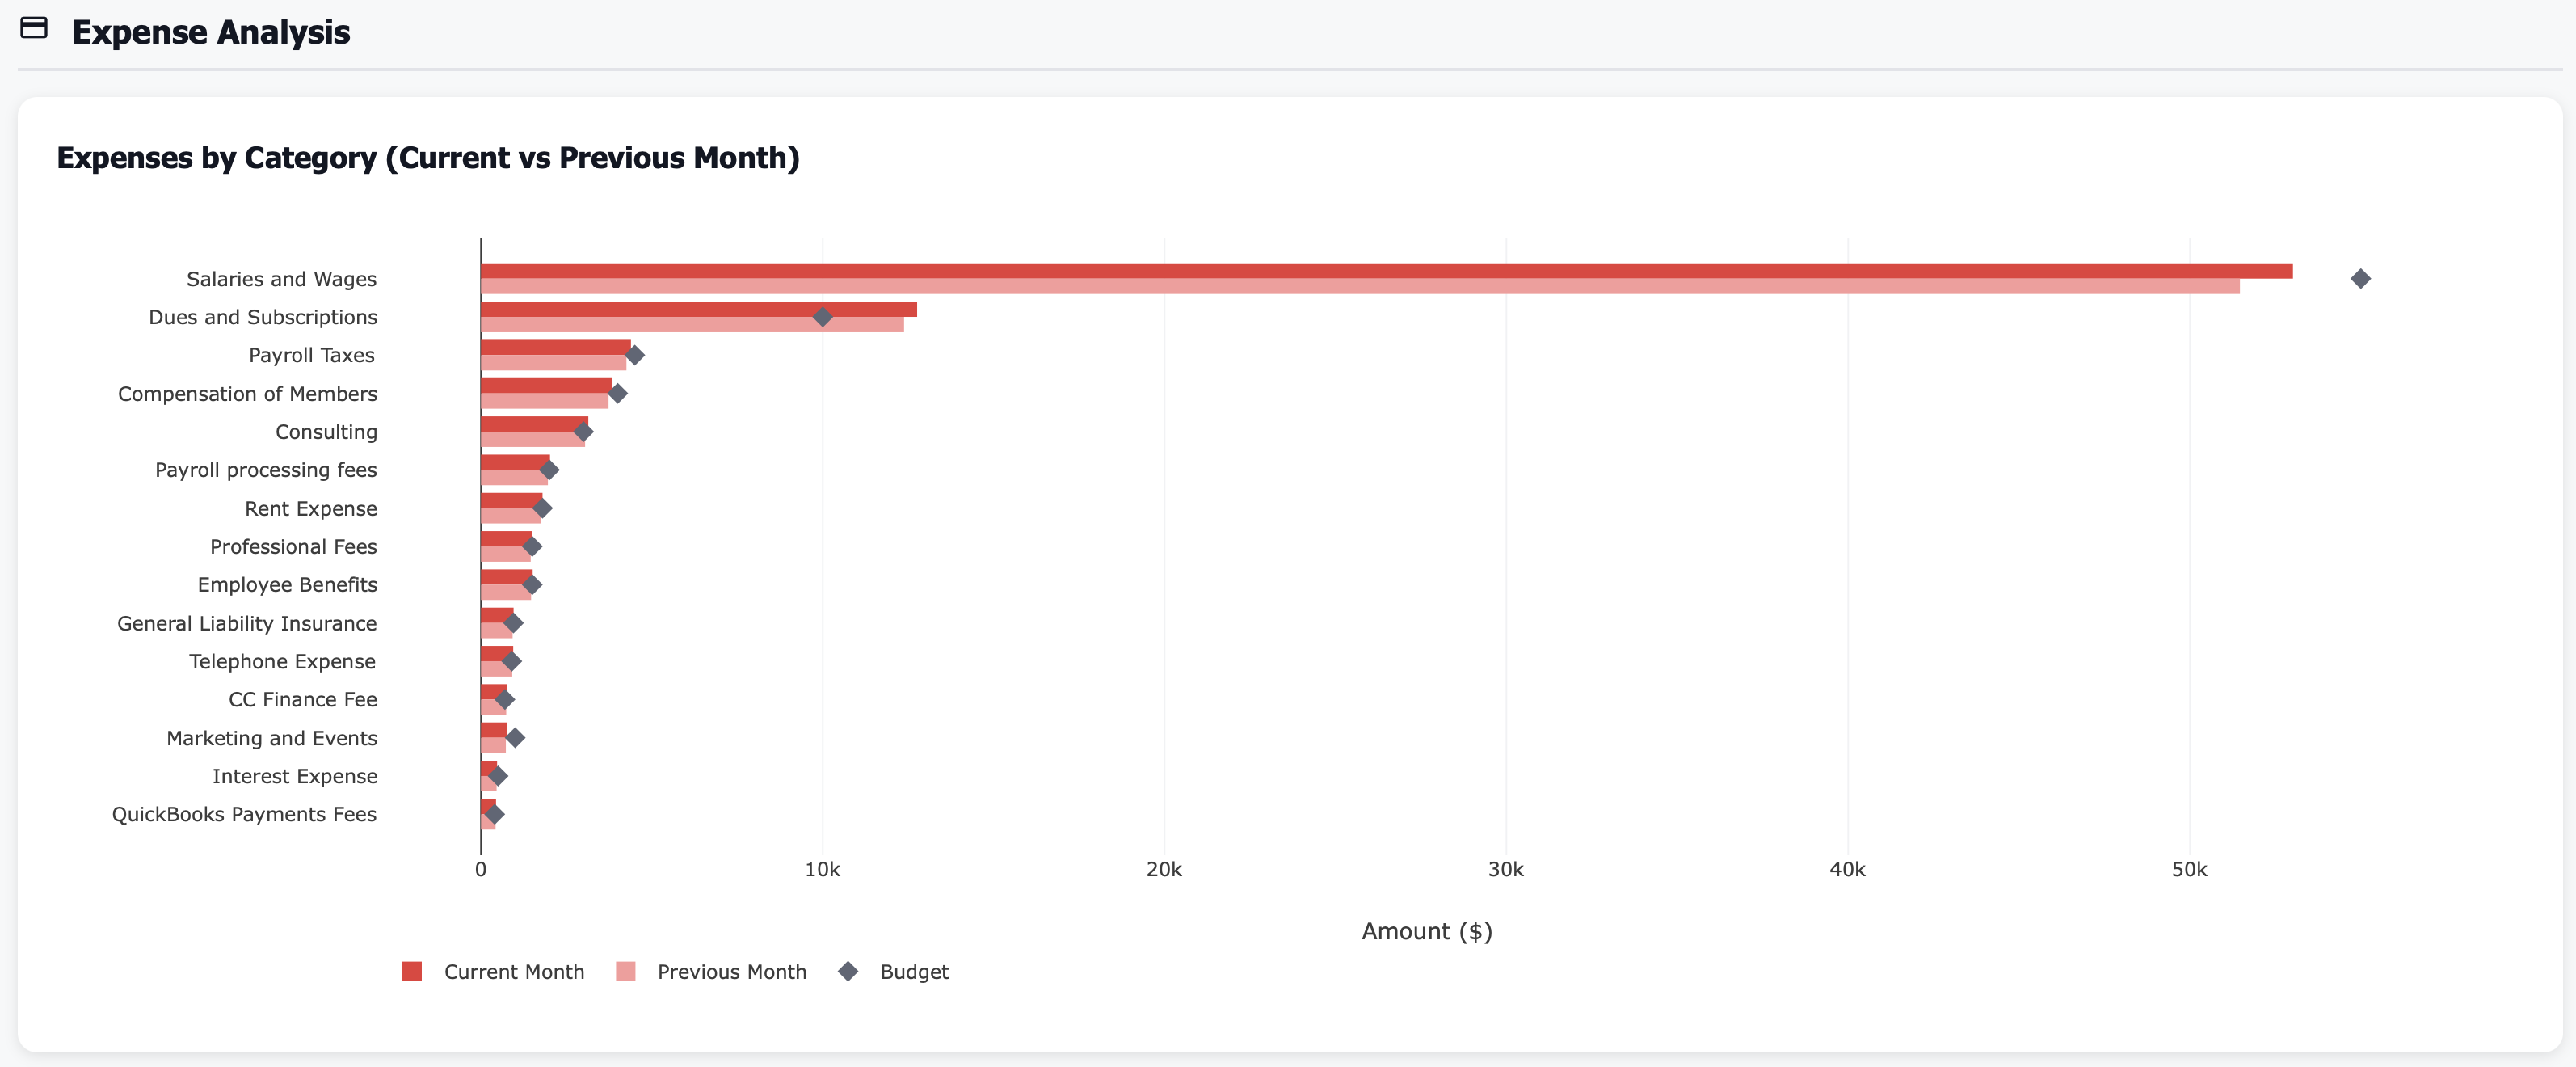
See where money goes:
Salaries & Wages: 59.3% of expenses ($53,012)
Dues & Subscriptions: 14.3% of expenses ($12,760) — 27% over budget!
Payroll Taxes: 4.9% of expenses ($4,387)
Compensation of Members: 4.3% of expenses ($3,846)
Consulting: 3.5% of expenses ($3,140)
Optimization opportunity: Dues & subscriptions $2,760 over budget—audit needed
Real Results: From P&L Blindness to Margin Mastery
Metric |
Before P&L Intelligence |
After 12 Months |
|---|---|---|
P&L visibility lag |
30-45 days (too slow) |
Real-time (actionable) |
Margin awareness |
Quarterly only |
Daily monitoring |
Expense overruns identified |
After 3-6 months |
Same month detected |
Client concentration known |
Annual review only |
Constantly tracked |
Budget variance tracking |
Quarterly reports |
Live dashboard |
Unprofitable months |
4 months/year (unnoticed) |
1 month/year (corrected fast) |
Average net margin |
2.3% (volatile, reactive) |
6.8% (stable, proactive) |
Annual profit improvement |
N/A |
$72K increase |
Features That Transform Financial Management
💰 Real-Time P&L Summary
See current month performance instantly:
Total income (all sources combined)
Total expenses (all categories combined)
Net income (profit or loss)
Net margin percentage
Comparison to prior month
Comparison to budget
Know profitability now, not 30 days from now.
📊 Income Breakdown by Source
Understand revenue composition:
Enterprise clients (recurring revenue)
Consulting income (project-based)
Subscription income (predictable)
One-time income (non-recurring)
Percent of total for each source
Month-over-month change
See which revenue streams are growing or declining.
💸 Expense Breakdown by Category
Track where money goes:
Salaries and wages (largest expense)
Dues and subscriptions (often overlooked)
Rent and occupancy costs
Professional fees
Marketing and sales expenses
Percent of total for each category
Budget comparison for each line
Identify expense creep before it kills margins.
📈 12-Month Trend Analysis
See the trajectory:
Income trend (growing or declining?)
Expense trend (controlled or creeping?)
Net income trend (improving or deteriorating?)
Margin trend (stable or volatile?)
Seasonal patterns identified
Year-over-year comparison
Spot trends early, intervene proactively.
Perfect For
CEOs / Founders
Monitor company profitability daily, understand margin drivers, track revenue mix changes, and make data-driven decisions on pricing, hiring, and investments
CFOs / Controllers
Replace manual P&L reports with real-time dashboards, provide executive team with instant financial visibility, and spend less time on reporting, more on analysis
Business Managers
Track department P&L performance, identify cost savings opportunities, understand client profitability, and manage budgets proactively throughout the year
Use Case: From $2,400 Loss to $11,500 Profit in 90 Days
Real Customer Story
Challenge: A professional services firm with $1.5M annual revenue was averaging 3.1% net margins but experiencing high volatility—some months profitable, others showing losses. They didn’t know why until 30-45 days after month-end when financials were closed. October showed a -$2,400 loss (margin: -1.8%), but they didn’t discover it until mid-November. By then, Q4 budget was set and no corrective action was possible for October.
Dashboard Revealed:
October income: $132,850 (down 5.2% from September’s $140,150)
October expenses: $135,250 (up 2.8% from September’s $131,500)
Net loss: -$2,400 (swing from +$8,650 profit in September)
Top client revenue: Down $4,200 from prior month (6% decline in largest client)
Dues & subscriptions: $18,900 (29% over budget, $4,250 overage)
Salaries: $78,400 (on budget, but revenue dropped so % of revenue increased)
Client concentration: 64% of revenue from largest client (high risk)
Margin trend: Declining from 6.2% in September to -1.8% in October (alarming)
Root cause: Revenue dip + uncontrolled subscription costs + no visibility until too late
Action Taken:
Immediate expense audit: Reviewed all dues & subscriptions line ($18,900)—found $2,650/month in unused software licenses, duplicate tools, and forgotten subscriptions
Client concentration risk: Scheduled strategic planning to diversify client base—set goal to reduce largest client from 64% to <50% of revenue within 6 months
Real-time P&L monitoring: Implemented weekly P&L reviews instead of waiting 30-45 days for month-end close
Revenue tracking: Created weekly revenue dashboard to catch client revenue declines within 7 days, not 30-45 days
Expense approvals: Required CFO approval for any new subscription >$150/month (prevent future subscription creep)
Budget alerts: Set up automated alerts when any expense category exceeds budget by >10%
Margin targets: Established 5.5% minimum net margin target—if trending below, trigger cost review
Client pipeline: Doubled sales efforts to land 2 new enterprise clients to reduce dependency on largest client
Pricing review: Analyzed all client pricing—found largest contract was underpriced, scheduled renegotiation
Monthly forecasting: Started forecasting next month’s P&L based on known contracts and run-rate expenses
Results After 90 Days (January):
January income: $145,700 (up 9.7% from October, new client added)
January expenses: $134,200 (down 0.8% from October despite revenue growth)
Net profit: $11,500 (margin: 7.9%)
Subscription savings: $2,650/month eliminated ($31,800 annual savings)
Client concentration: Down to 52% (added one new client, consulting income up)
Margin trend: Improved from -1.8% (Oct) to 5.8% (Nov) to 6.9% (Dec) to 7.9% (Jan)
Budget variance: All expense categories within 5% of budget (subscriptions back to $14,650 budget)
P&L visibility: Real-time (know profitability by day 5 of each month)
Client pipeline: 2 new clients signed, 3 more in late-stage negotiations
Contract renegotiation: Largest client contract renegotiated for 10% rate increase starting Q1
Annual impact: $98K additional profit (eliminating subscription waste + margin improvement)
“We thought we were doing fine because annual revenue was growing. The real-time P&L dashboard showed us we were losing money some months due to expense creep and client concentration risk. Fixing it in 90 days saved the year.” — CEO
Key Metrics You’ll Track
Technical Integration (Works With Your Stack)
Frequently Asked Questions
Q: How is net margin calculated? A: Net income ÷ Total income. For example, $6,096 net income on $93,927 revenue = 6.5% net margin. Healthy margins for services businesses are typically 10-20%.
Q: What’s a good net margin target for a services business? A: 10-20% is healthy. Below 5% means you’re operating on thin margins with little buffer for downturns. Above 25% is exceptional and indicates strong pricing power or lean operations.
Q: How do I reduce client concentration risk? A: Diversify revenue streams. If one client is >50% of revenue, prioritize landing new clients. Target: No single client >30% of revenue, top 3 clients <70% combined.
Q: What if expenses are growing faster than revenue? A: This is margin compression. Identify which expense categories are growing fastest, audit for waste (unused subscriptions, inefficient processes), and implement approval processes for new expenses.
Q: Can I compare P&L across multiple business units or departments? A: Yes. If you track income and expenses by department or business unit in your accounting system, the dashboard can show P&L by segment.
Q: How quickly should I see P&L data each month? A: Best practice: Within 5-7 business days of month-end. This allows you to take corrective action in the current month rather than waiting until it’s too late.
Q: What causes high P&L volatility (profit one month, loss the next)? A: Common causes: lumpy project revenue (big invoices some months, none others), uncontrolled variable expenses, or client payment timing. Solutions: Retainer contracts for predictable revenue, expense budgets with monthly targets.
Q: Should I track cash-based or accrual-based P&L? A: Accrual-based P&L (revenue when earned, expenses when incurred) gives a more accurate picture of profitability. Cash-based P&L (revenue when paid, expenses when paid) shows cash flow but can be misleading for profitability.
Stop Flying Blind on Your Financials
Every month without P&L intelligence means:
Learning you lost money 30 days too late to fix it
Expense categories creeping up 10-15% annually without notice
Client concentration risk building undetected
Margin erosion happening slowly, discovered suddenly
Budget variances piling up unchecked until quarterly review
No data to make smart decisions on pricing, hiring, or cost cuts
For a $1M revenue business, improving margins from 2% to 8% = $60K additional annual profit.
The question isn’t whether you need P&L intelligence.
The question is: How much profit are you leaving on the table by not seeing your numbers clearly?
Related Topics
Ready to Get Started?
Schedule a personalized demo to see this dashboard in action.
Schedule Demo Contact Sales