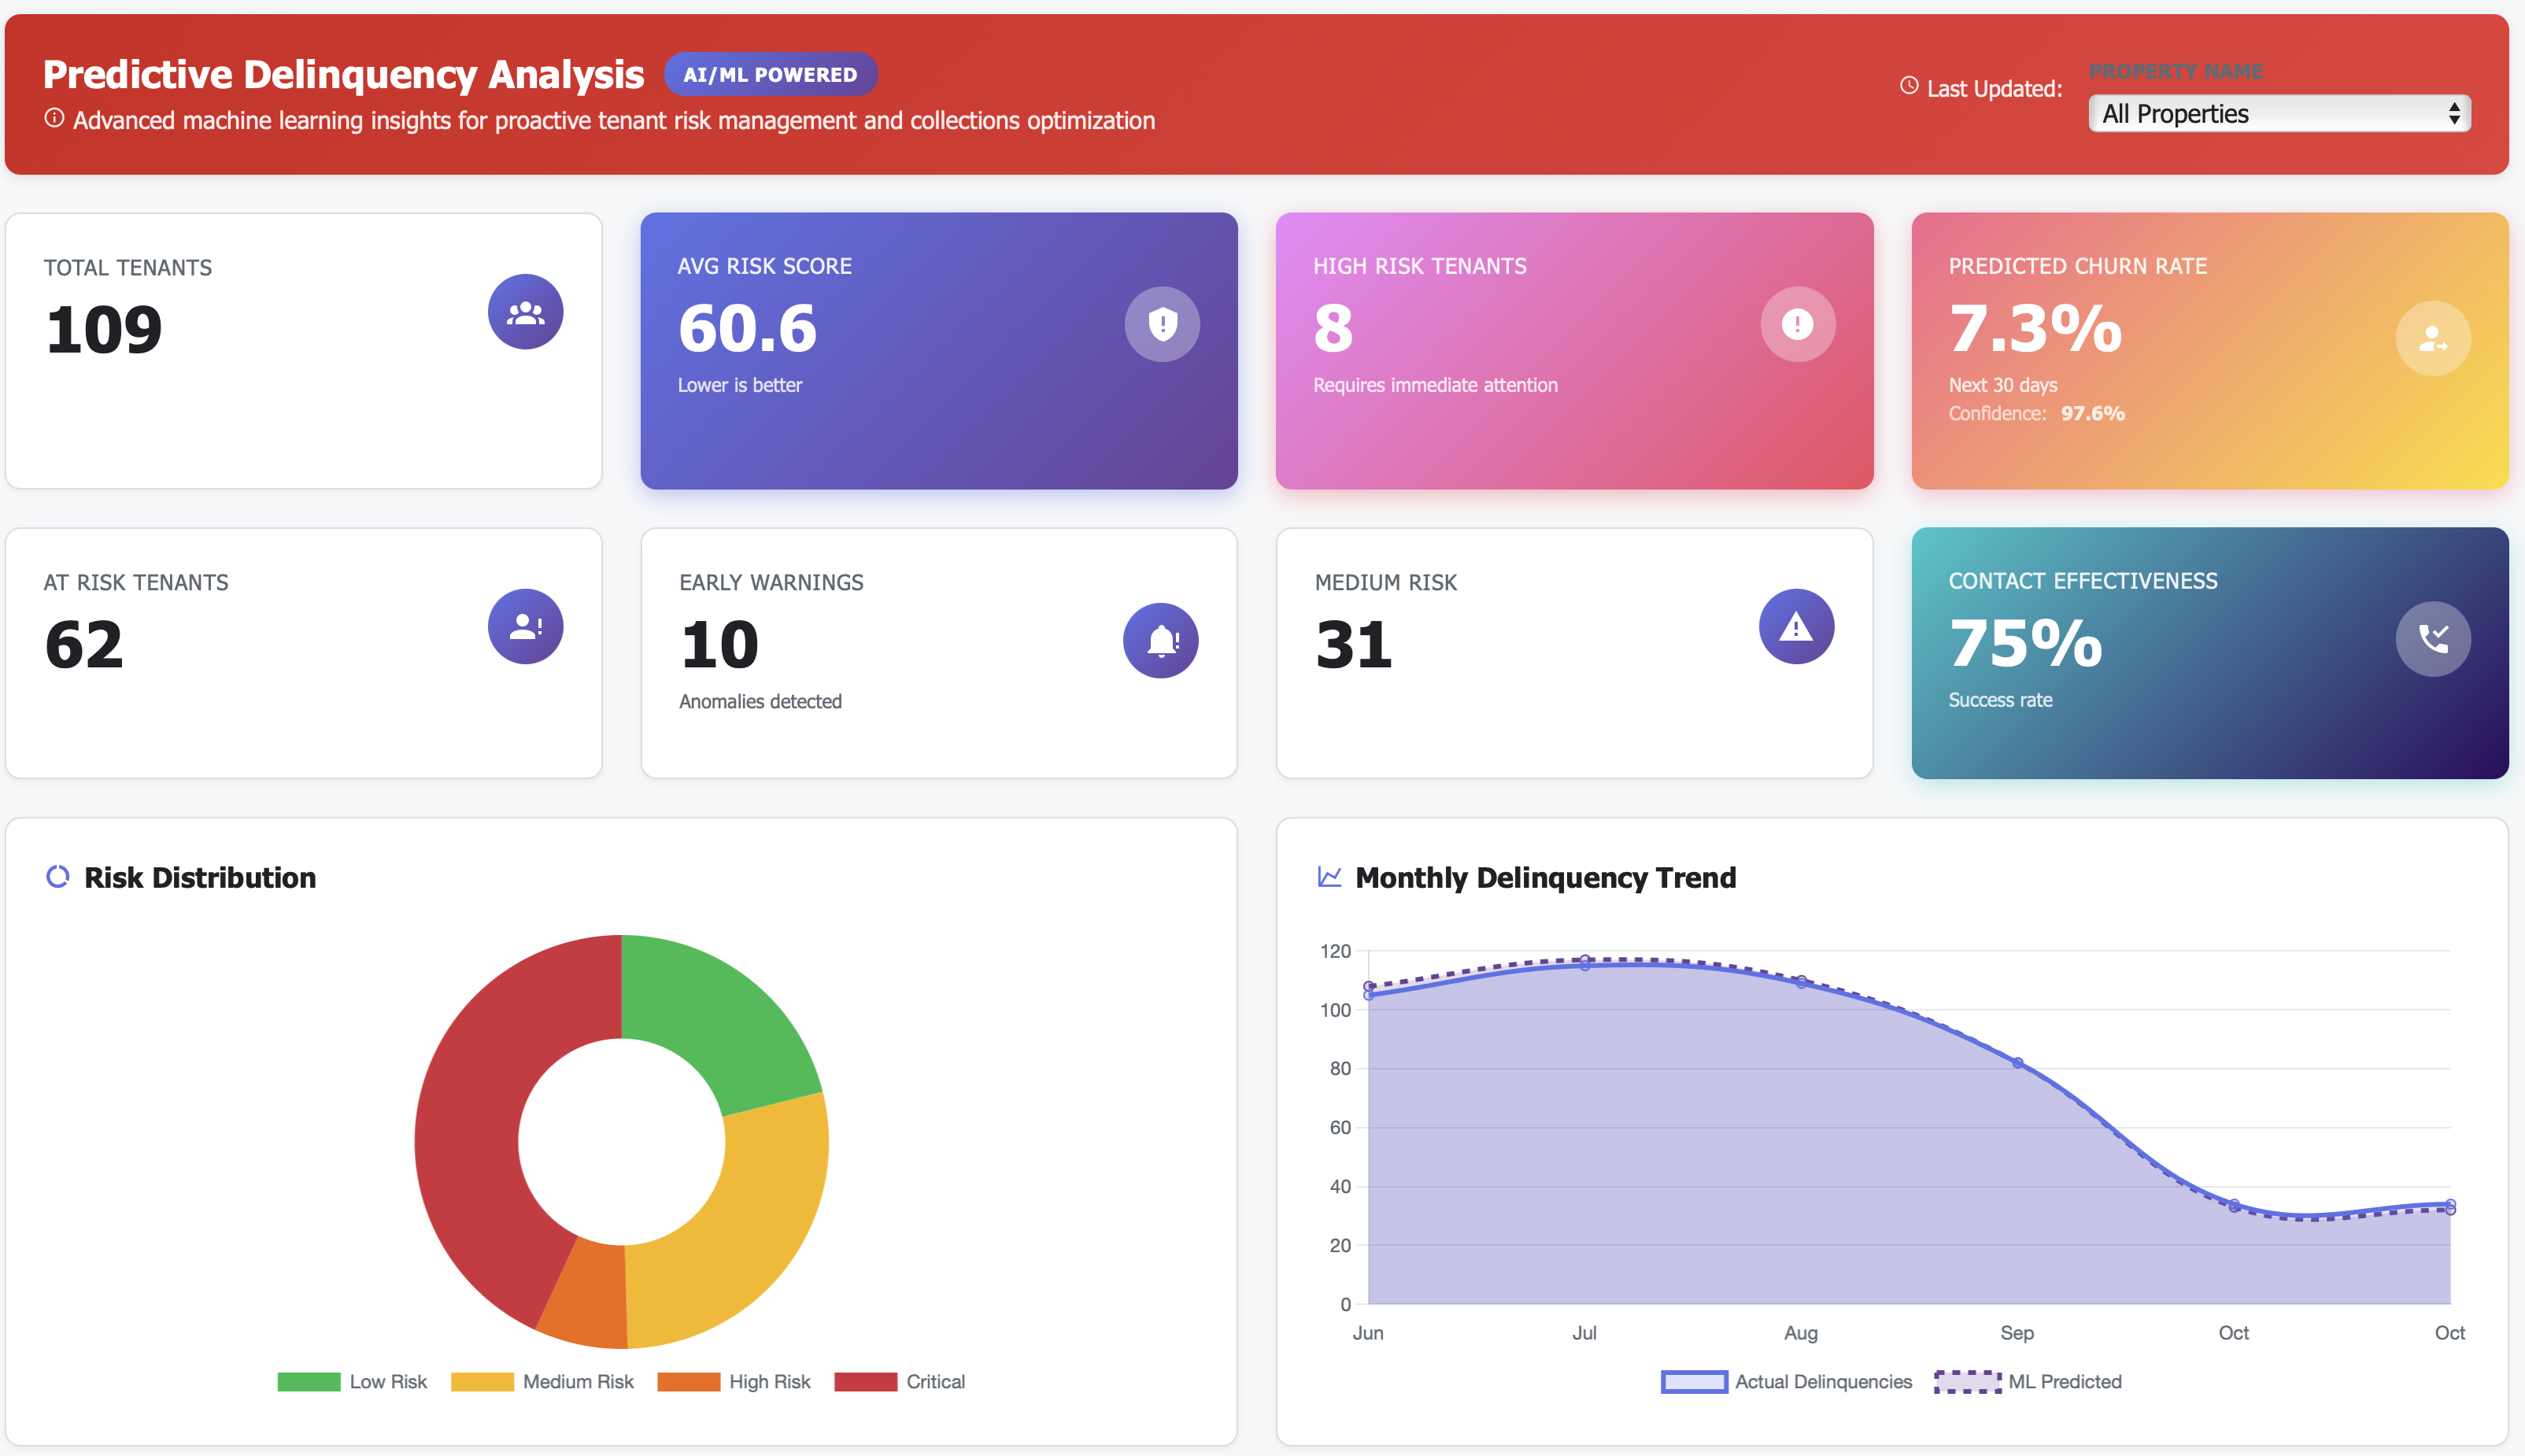
Predictive Delinquency Dashboard
Track every delinquent account from day 1, see aging buckets (1-15, 16-30, 31-60, 60+ days), prioritize high-dollar accounts automatically, and benchmark collection performance across properties. Most portfolios reduce delinquency rates by 150-300 basis points, recovering $150K-$300K annually per 500 units through systematic collections management.

Getting Started
1️⃣ Connect Your Property Management System Link your PM system to pull current balances, payment history, and ledger data for all residents. This establishes your baseline delinquency status.
2️⃣ Import Historical Data Upload 12-24 months of historical delinquency and payment data. This shows trends, seasonal patterns, and establishes recovery rate baselines.
3️⃣ Define Your Thresholds Set your aging buckets (1-15, 16-30, 31-60, 60+ days), high-dollar thresholds (\(1K, \)2K), and target delinquency rate (2.5%? 3%?).
4️⃣ Configure Alerts Set up alerts for: delinquencies hitting 15 days, high-dollar accounts (>$1K), payment plan defaults, and property-level delinquency rate spikes.
5️⃣ Train Your Team Train property managers on the dashboard—how to prioritize accounts, log contacts, track payment plans, and escalate appropriately.
6️⃣ Start Improving Week one: Identify and contact all high-dollar delinquencies. Month one: Reduce average days to first contact to <3 days. Quarter one: Reduce delinquency rate by 100+ basis points.
Stop Chasing Rent After It’s Too Late: Delinquency Intelligence That Protects Cash Flow
Track every delinquent account from day 1. See who’s 3 days late, who’s 15 days late, who’s 30+ days late—take action at the right time, not when it’s too late.
Know which accounts are \(200 past due vs. \)2,000 past due. Focus your team on high-dollar delinquencies first—recover 80% of dollars with 20% of effort.
See patterns: Are delinquencies spiking at one property? Is one payment method failing? Are certain unit types struggling? Fix systemic issues, not just individual accounts.
The Delinquency Problem Bleeding Your Cash Flow
If you’re managing collections across properties, these blindspots are costing you thousands monthly:
⚠️ Late visibility: Finding out residents are 15+ days delinquent when you should have known at day 3
⚠️ Priority confusion: Chasing \(150 delinquencies while \)2,000+ accounts sit uncontacted for weeks
⚠️ Property-level blindness: No idea that Property C has 8% delinquency rate while Property A has 2%—what’s different?
⚠️ Contact inefficiency: Calling residents at wrong times (during work hours), low answer rates, wasted staff time
⚠️ No aging buckets: Can’t see the split between 1-15 days, 16-30 days, 31-60 days, 60+ days past due
⚠️ Eviction timing chaos: Not knowing which delinquencies warrant legal action and which will resolve
⚠️ Payment plan tracking failure: Offered payment plans but no systematic tracking of who’s compliant vs. who defaulted
⚠️ Trend blindness: Delinquency climbing from 3.5% to 5.2% over 6 months—noticed too late to course-correct
Every 1% of annual revenue lost to uncollected rent = \(500K-\)1M on a $50M revenue portfolio. Time to get control.
Your New Reality: Complete Delinquency Visibility
Delinquency Aging Analysis
Know your exposure by age:
1-15 days past due: 42 accounts, $14,200 total (manageable)
16-30 days: 18 accounts, $18,400 total (escalate outreach)
31-60 days: 8 accounts, $12,800 total (payment plans or legal)
60+ days: 4 accounts, $9,200 total (eviction proceedings)
Focus resources where recovery is still possible
Property-Level Delinquency Comparison

Identify problem properties:
Harbor View: 2.1% delinquency rate, $4,200 outstanding (excellent)
Sunset Ridge: 3.8% delinquency rate, $8,950 outstanding (on target)
Riverside Commons: 5.2% delinquency rate, $13,400 outstanding (elevated)
Parkview Estates: 8.7% delinquency rate, $22,100 outstanding (CRISIS)
Target interventions where collection processes are failing
Delinquency Trend (12-Month)
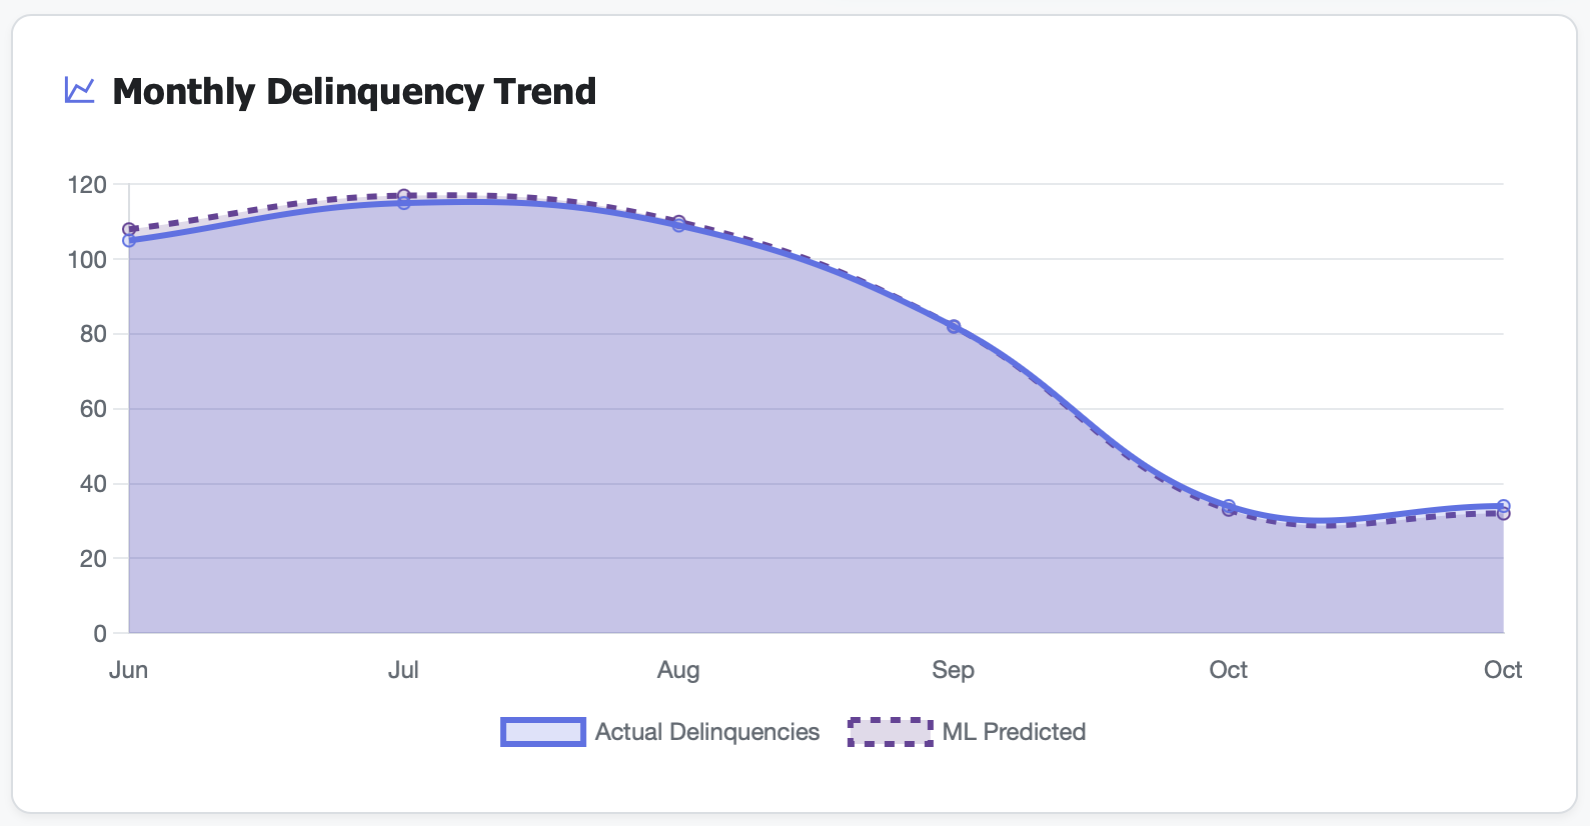
See the trajectory:
Jan-Jun: Steady 3.2-3.5% (healthy baseline)
Jul-Aug: Spike to 4.8% (seasonal? economic?)
Sep-Dec: Climbed to 5.2% and holding (concerning trend)
Catch problems early, intervene before crisis
Real Results: From Collection Chaos to Cash Flow Control
Metric |
Before Delinquency Intelligence |
After 12 Months |
|---|---|---|
Portfolio delinquency rate |
5.8% (unacceptable) |
2.9% (controlled) |
Average days to first contact |
9 days (too slow) |
2 days (immediate action) |
High-dollar delinquencies (>$1K) |
18 accounts (untracked) |
4 accounts (aggressively managed) |
Property C delinquency rate |
9.2% (bleeding cash) |
3.8% (normalized) |
Payment plan compliance rate |
42% (poorly tracked) |
78% (monitored closely) |
Eviction filings |
24 annually (reactive) |
12 annually (earlier intervention) |
Collections recovered vs written off |
68% recovery rate |
89% recovery rate |
Annual bad debt expense |
$285K (2.8% of revenue) |
$98K (0.9% of revenue) |
Features That Transform Collections Management
📊 Real-Time Delinquency Dashboard
See portfolio-wide delinquency status instantly:
Total delinquent accounts (count)
Total dollars outstanding
Delinquency rate as % of gross potential rent
Change vs. prior month (trending up or down?)
One screen, complete picture.
📅 Aging Bucket Analysis
Break down delinquencies by time past due:
1-15 days (early stage, high recovery rate)
16-30 days (escalation needed)
31-60 days (payment plans or legal notices)
60+ days (eviction proceedings likely)
Match collection tactics to delinquency age.
💰 High-Dollar Delinquency Alerts
Automatically flag accounts over thresholds:
$1,000+ past due (priority attention)
$2,000+ past due (immediate escalation)
$3,000+ past due (legal action consideration)
Focus on high-dollar accounts—they drive 70-80% of total exposure.
🏢 Property-Level Benchmarking
Compare delinquency rates across all properties:
See which properties have effective collection processes
Identify properties with systemic issues
Compare similar property types (Class A vs Class B)
Replicate best practices from top performers.
Perfect For
Property Managers
Track delinquencies daily, prioritize collection efforts, manage payment plans, and reduce bad debt through early intervention and systematic follow-up
Regional/Portfolio Managers
Benchmark collections performance across properties, identify underperforming collection processes, and replicate best practices portfolio-wide
CFOs / Controllers
Monitor portfolio-wide delinquency exposure, forecast bad debt expense, track collections ROI, and ensure cash flow predictability for investors
Use Case: From 5.8% to 2.9% Delinquency Rate ($187K Annual Savings)
Real Customer Story
Challenge: A 650-unit, 4-property portfolio had a 5.8% delinquency rate (nearly 2x industry average). Collections were reactive, no systematic tracking of aging buckets or high-dollar accounts, and no property-level visibility. Annual bad debt write-offs: $285K (2.8% of revenue). One property (Parkview Estates) was at 9.2% delinquency but management didn’t know it until quarterly review.
Dashboard Revealed:
Portfolio delinquency rate: 5.8% (38 accounts, $124K outstanding)
Parkview Estates: 9.2% delinquency rate (\(48K of the \)124K—39% of portfolio exposure)
High-dollar delinquencies: 18 accounts over \(1,000 (total \)68K, 55% of exposure)
Aging breakdown: 45% were 30+ days past due (should have escalated earlier)
Average days to first contact: 9 days (far too slow)
Contact tracking: None—no record of outreach attempts or outcomes
Payment plans: 8 active plans, but no tracking of compliance (5 had defaulted)
Property A (Harbor View): 2.3% delinquency rate—what were they doing differently?
Root cause: No standardized collection process across properties
Trend: Delinquency rate climbed from 4.2% to 5.8% over 6 months (unnoticed)
Action Taken:
Immediate high-dollar focus: Created list of 18 accounts >$1K past due, assigned to senior collections staff, contacted within 48 hours
Parkview Estates intervention: Discovered property had new manager (3 months) with no collections training—assigned mentor from Harbor View
Standardized collection process: Implemented Harbor View’s successful process portfolio-wide:
Day 1 late: Automated email/text reminder
Day 3 late: Personal phone call
Day 7 late: Door knock visit
Day 14 late: Payment plan offer or legal notice
Payment plan tracking: Required weekly payment plan compliance check, automated reminders before payment due dates
Daily delinquency review: Each property manager reviewed dashboard daily, prioritized accounts by dollar amount and days late
Weekly portfolio review: Regional manager reviewed all delinquencies 30+ days weekly, high-dollar delinquencies 15+ days daily
Contact logging requirement: All collection contacts logged in system with outcome, next action scheduled
Early escalation: Moved legal notice threshold from 30 days to 21 days for non-communicative residents
Root cause fix: Changed payment due date for residents paid monthly (15th vs 1st) after identifying this cohort had higher delinquency
Training: All property managers completed collections best practices training from Harbor View manager
Results After 12 Months:
Portfolio delinquency rate: 2.9% (down from 5.8%, 50% reduction!)
Parkview Estates delinquency: 3.8% (down from 9.2%, 59% reduction)
High-dollar delinquencies: 4 accounts (down from 18, 78% reduction)
Delinquent accounts: 19 total (down from 38, 50% reduction)
Average days to first contact: 2 days (down from 9 days)
Payment plan compliance: 78% (up from 42%, better tracking and follow-up)
Recovery rate: 89% (up from 68%, earlier intervention works)
Eviction filings: 12 annually (down from 24, earlier payment plans reduced need)
Bad debt write-offs: \(98K (down from \)285K, 66% reduction)
Annual savings: $187K in reduced bad debt
Cash flow improvement: Reduced outstanding delinquency from \(124K average to \)61K average
Collections staff efficiency: Same team handling 50% fewer delinquent accounts (more time for resident services)
“We knew delinquency was high, but we didn’t know it was concentrated in one property and 18 high-dollar accounts. Once we could see it, we fixed it in 90 days.” — Regional Property Manager
Key Delinquency Metrics You’ll Track
Technical Integration (Works With Your Stack)
Frequently Asked Questions
Q: How is delinquency rate calculated? A: Total dollars past due ÷ Gross potential rent. For example, \(50K past due on a \)1M annual revenue property (monthly: $83K) = 60% delinquency rate for that month. More commonly shown as: Delinquent accounts ÷ Total occupied units.
Q: What’s a good target delinquency rate? A: Industry average is 3-4%. Best-in-class properties run at 2-2.5%. Anything above 5% indicates collections process problems that need immediate attention.
Q: How do you track payment plan compliance? A: Each payment plan is logged with terms (amount, frequency, end date). The system alerts when payments are due and flags when a resident misses a payment plan payment.
Q: Can I see which collection tactics work best? A: Yes. Track contact methods (call, text, email, door knock) and outcomes (promise to pay, payment plan, no contact). See which methods have highest success rates.
Q: What if we use a third-party collections agency? A: The dashboard can track accounts sent to collections, amounts recovered by the agency, and costs/fees. See if in-house collections or agency collections perform better.
Q: Can I compare delinquency rates across different property classes? A: Yes. Benchmark Class A properties against each other, Class B against Class B, etc. Or compare by unit type, resident segment, or any other category.
Q: How quickly should we move to legal action? A: Best practice: If resident is non-responsive after 3 contact attempts and 14-21 days past due, issue legal notice. If they engage but can’t pay in full, offer payment plan. Data shows earlier escalation (21 days vs 30 days) improves recovery rates.
Q: What causes high delinquency rates? A: Common root causes: weak screening criteria, ineffective collection processes, slow contact timing, poor payment plan management, economic downturns in the area, or seasonal employment patterns (tourism areas, college towns).
Stop Accepting Delinquency as “Just Part of the Business”
Every month without delinquency intelligence means:
High-dollar accounts aging to 30-60+ days before you prioritize them
Properties with 8-9% delinquency rates bleeding cash unnoticed
No systematic process—collection effectiveness depends on which manager is working
Payment plans failing because no one’s tracking compliance
Writing off 2-3% of revenue as bad debt when industry leaders write off 0.5-1%
Cash flow volatility making it hard to predict monthly income
Every 1% improvement in delinquency rate = \(200K-\)400K annually on a $40M revenue portfolio.
The question isn’t whether you need delinquency intelligence.
The question is: How much cash is sitting in delinquent accounts right now that you could recover with better visibility?
Related Topics
Ready to Get Started?
Schedule a personalized demo to see this dashboard in action.
Schedule Demo Contact Sales