Occupancy Analytics Dashboard
Never get blindsided by vacancy again. Predict which leases are at risk, identify exactly where prospects fall off in your leasing funnel, and see every dollar you're leaving on the table from below-market rents. Most properties improve renewal rates from 58% to 72%+ and reduce vacancy duration by 30-40% through proactive management.
Getting Started
1️⃣ Connect Your PMS Link your property management system via secure API or OAuth. Takes about 20 minutes. We handle the technical setup.
2️⃣ Import Historical Data We pull in 12-24 months of occupancy, leasing, and renewal data. This creates your baseline and enables immediate trend analysis.
3️⃣ Start Preventing Problems Day one: See your loss-to-lease, renewal risk, and vacancy trends. Week one: Fix your first leasing bottleneck. Month one: Capture your first $5K+ in previously lost revenue.
Never Get Blindsided by Vacancy Again: Occupancy Analytics
Stop reacting to vacancy—anticipate it. Know which leases are at risk, which units will struggle, and exactly when to act.
Identify exactly where prospects fall off. Is it showings? Applications? Approvals? Stop guessing and start fixing the real bottleneck.
See every dollar you’re leaving on the table from below-market rents. Most properties find $10K-50K+ in monthly loss-to-lease they never knew existed.
The Occupancy Blindspot Killing Your NOI
If you’re managing multifamily properties, these problems are costing you money right now:
🔴 Renewal surprises: 15 leases expiring next month and you just found out
🔴 Vacancy that lingers: Units sitting empty 60+ days while you wonder why
🔴 Conversion mystery: Tours are up but leases are flat—where’s the breakdown?
🔴 Pricing paralysis: Is 4.2% vacancy good? Bad? Should you raise rents or lower them?
🔴 Below-market bleeding: Dozens of units renting $100-200 below market, month after month
Every day of delayed insight = thousands in lost revenue. Time to see clearly.
Your New Reality: Complete Occupancy Intelligence
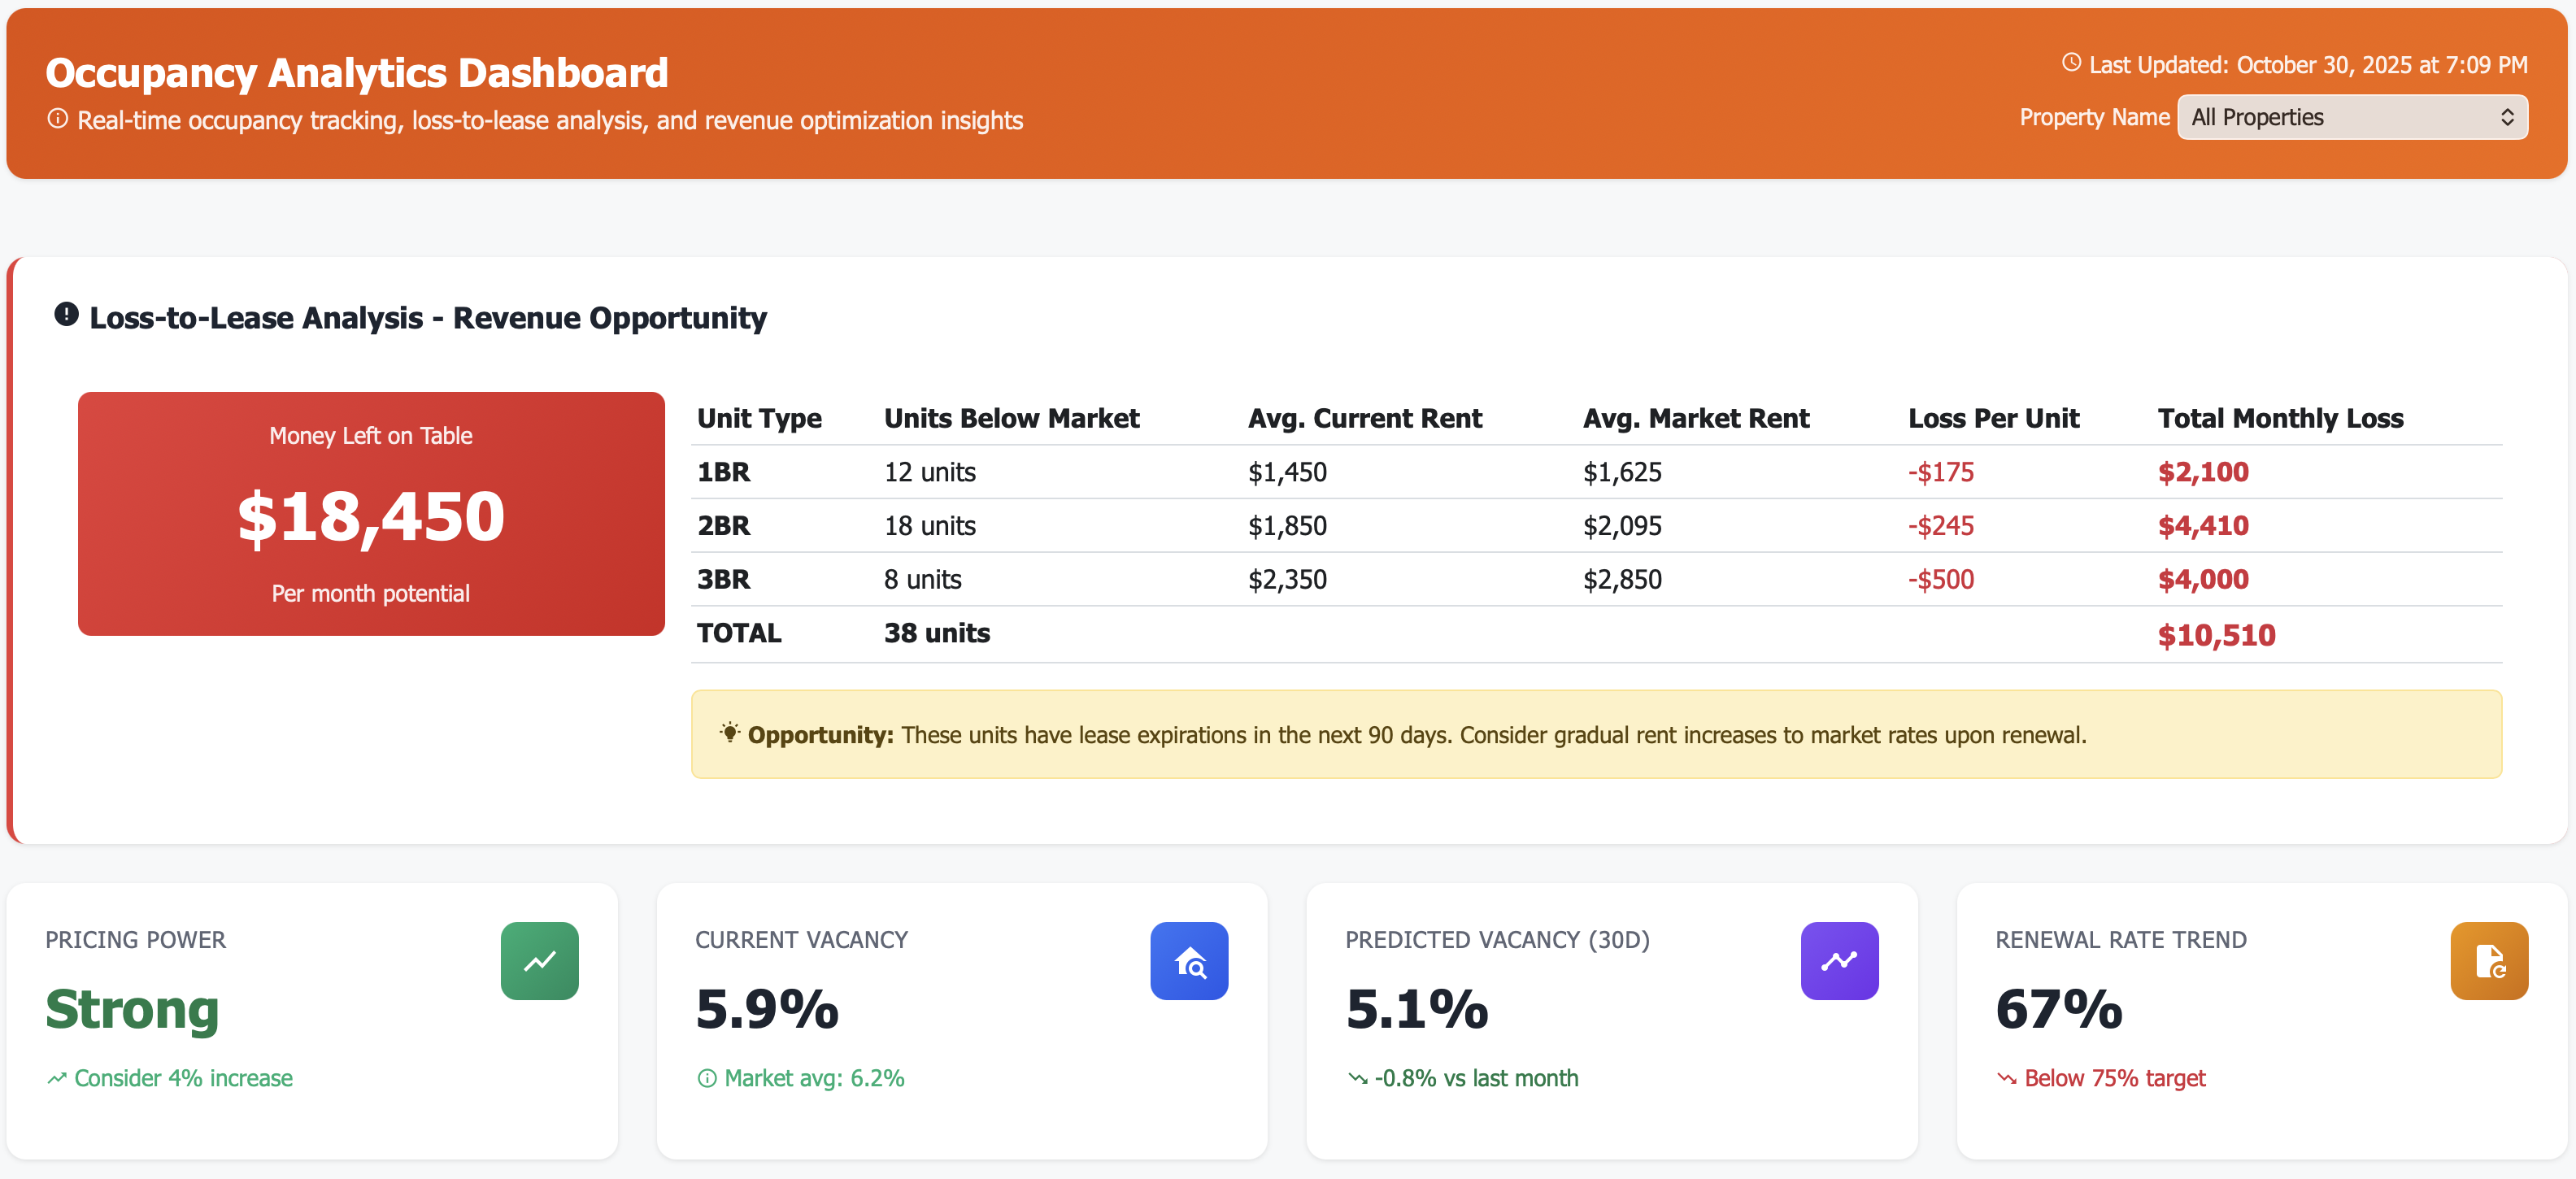
Loss-to-Lease Analysis
The number that matters most:
Total monthly revenue left on table
Breakdown by unit type (1BR, 2BR, 3BR)
Which specific units are below market
Immediate action recommendations
Most properties discover $10K-50K+ in hidden monthly revenue
Leasing Funnel Performance
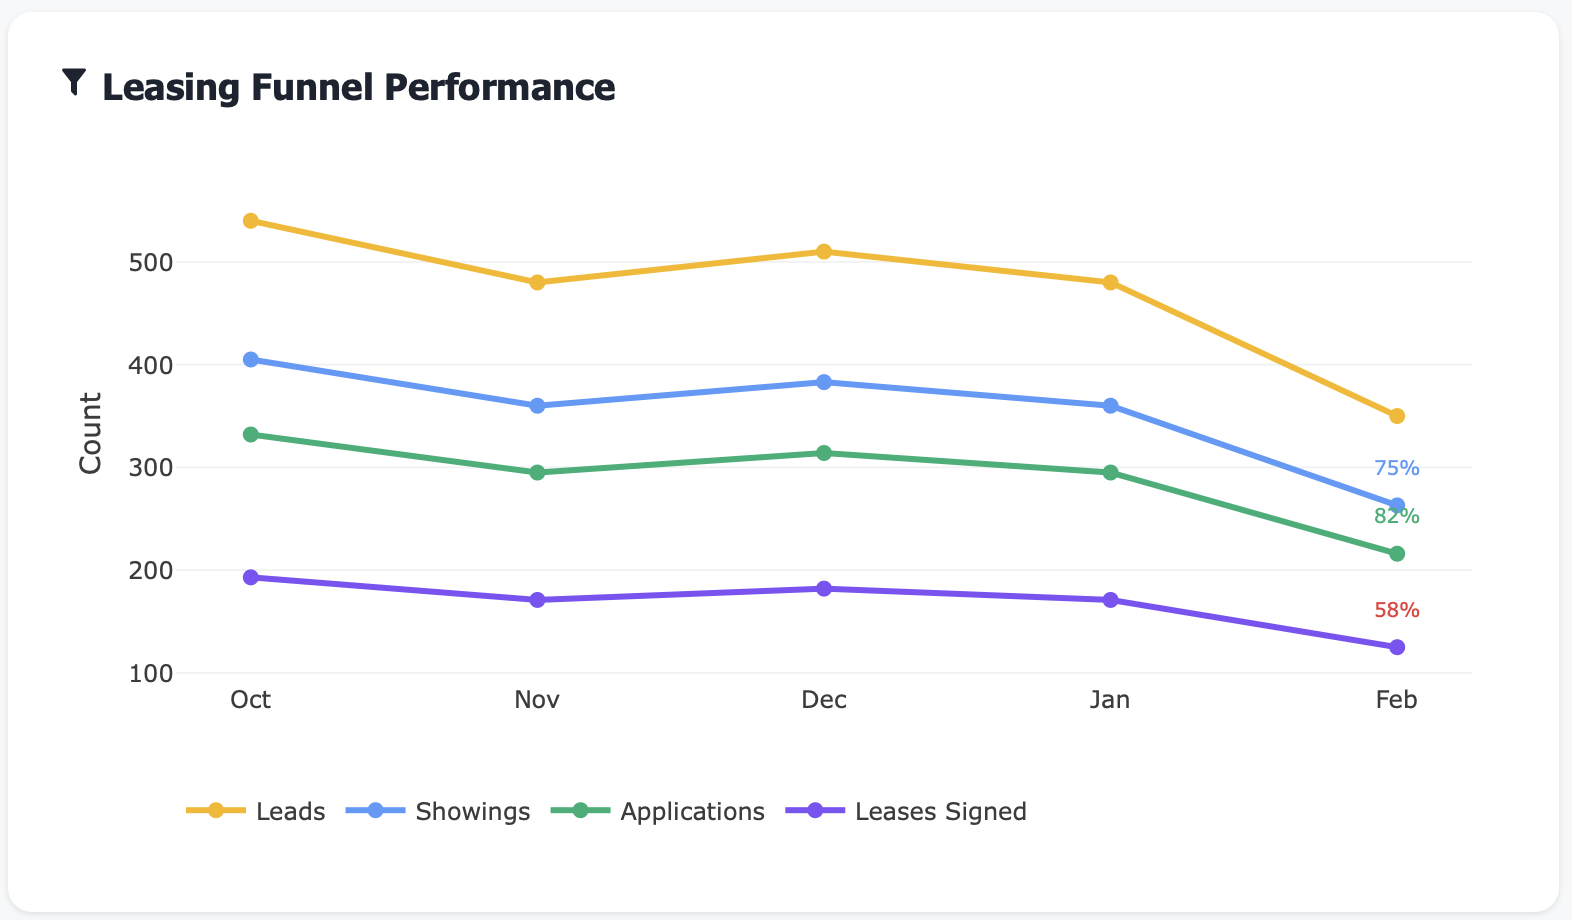
Track every step:
Leads → Showings (75% conversion)
Showings → Applications (82% conversion)
Applications → Leases (58% conversion)
Compare to industry benchmarks
Instantly identify where you’re losing prospects
Renewal Risk Analysis
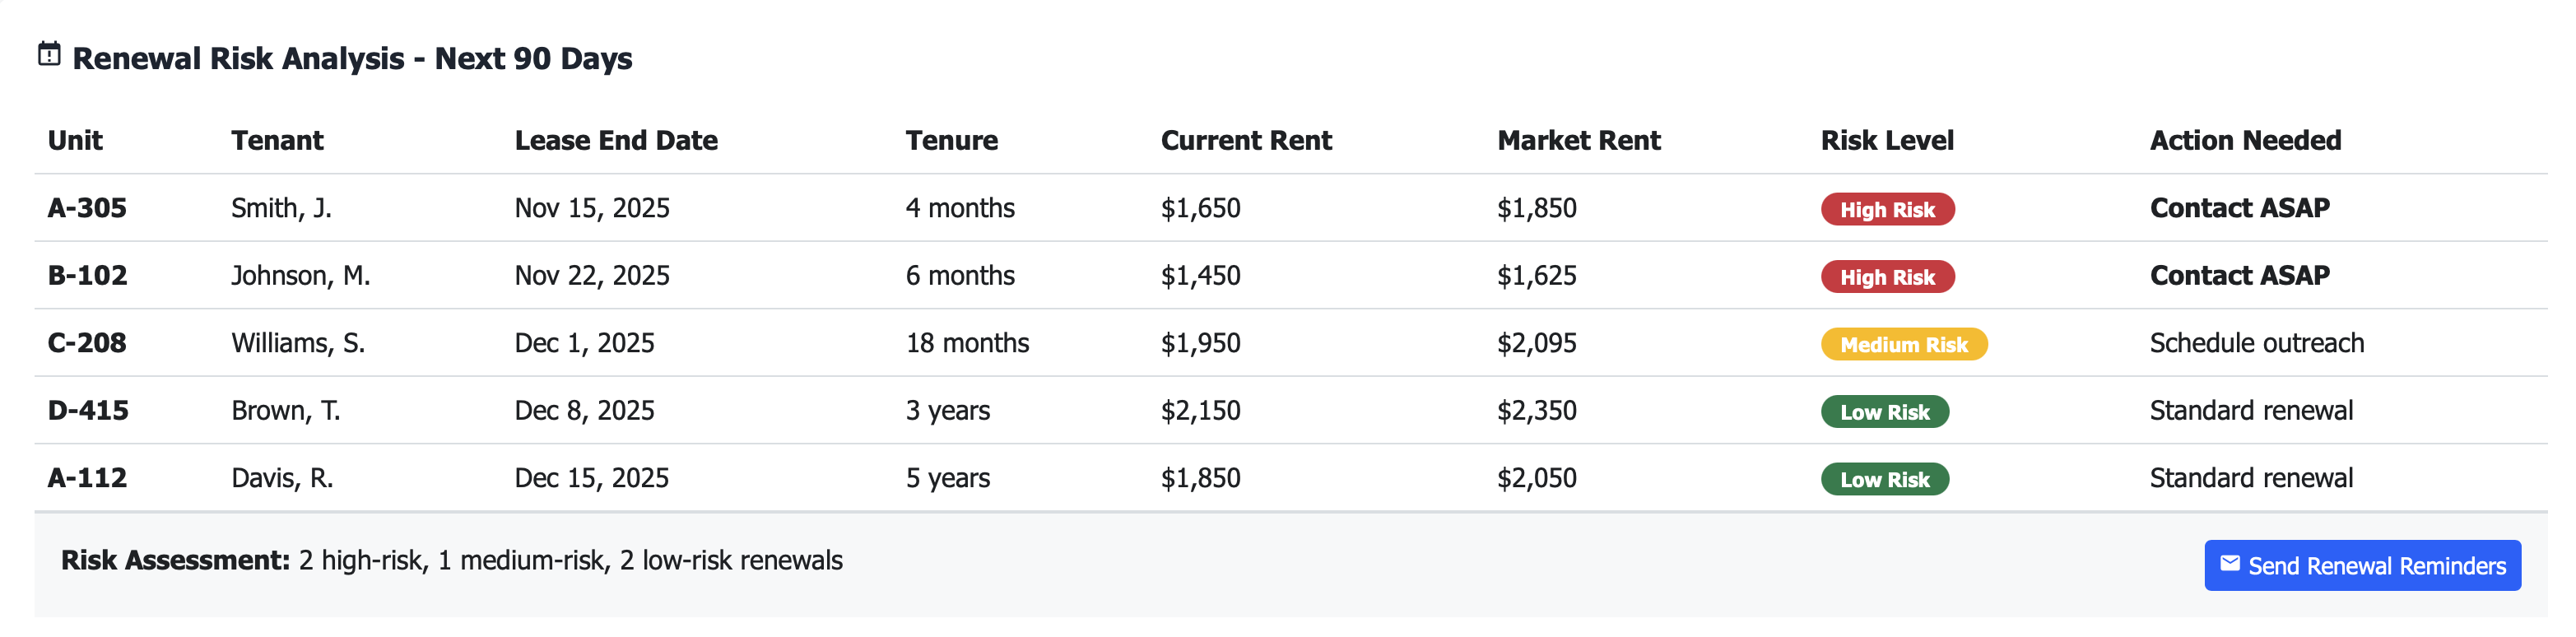
Know who’s at risk:
All expirations next 90 days
Risk level by tenant (tenure, rent gap)
Proactive outreach recommendations
Market rent vs current rent comparison
Never miss a renewal opportunity again
Real Results: From Blind to Crystal Clear
Metric |
Before Occupancy Dashboard |
After 6 Months |
|---|---|---|
Average vacancy duration |
58 days (unknown variance) |
34 days (consistent) |
Renewal rate |
58% (reactive) |
72% (proactive) |
Loss-to-lease awareness |
$0 (didn’t track) |
$18K/month identified & captured |
Application→Lease conversion |
52% (couldn’t diagnose) |
67% (fixed screening bottleneck) |
Problem unit identification |
Quarterly reviews |
Real-time alerts |
Revenue recovered |
— |
$216K annually |
Features That Eliminate Surprises
🚨 Early Warning Alerts
Get notified before problems become crises. Renewal rate trending down? Units vacant too long? Conversion rate dropping? You’ll know immediately—not three weeks later.
📊 Pricing Power Indicator
Clear signal on whether you have room to raise rents or need to ease off. Based on your actual vacancy rate, market conditions, and demand/supply trends.
⏱️ Vacancy Duration Tracking
See exactly how long each unit has been vacant. Color-coded alerts for problem units (60+ days). Immediate visibility into which units need pricing adjustments or updates.
🎯 Conversion Ratio Benchmarking
Compare your funnel performance to industry standards at every stage:
Leads → Showings (your 75% vs industry 65%)
Showings → Applications (your 82% vs industry 70%)
Applications → Leases (your 58% vs industry 75%)
See exactly where you’re winning and where you’re losing.
📈 Market Tension Index
Visual chart showing demand vs supply trends. When demand exceeds supply = pricing power. When supply exceeds demand = softer market. Make pricing decisions with confidence.
💰 Projected Occupancy vs Budget
Never get caught off guard by budget variance. See projected occupancy 30-60 days out based on current trends. Compare to budget. Adjust strategy before the quarter ends.
📅 Lease Expiration Calendar
12-month forward view of all expiring leases. Identify dangerous expiration waves. Plan renewal campaigns ahead of time. No more scrambling.
Perfect For
Property Managers
Run leasing operations with complete visibility into vacancy risk, renewal performance, and revenue optimization opportunities
Regional Managers
Compare occupancy performance across properties, identify best practices, and deploy resources where they’ll have maximum impact
Asset Managers
Monitor occupancy trends, loss-to-lease exposure, and revenue forecasts to make confident capital allocation decisions
Use Case: The Renewal Crisis That Never Happened
Real Customer Story
Challenge: A 280-unit property had “normal” 60% renewal rates, but leadership felt it should be higher. They had no visibility into why residents were leaving.
Dashboard Revealed:
23 leases expiring in next 30 days (they only knew about 12)
8 “high-risk” renewals based on short tenure + large rent gaps
Average days-to-renewal-offer: 18 days before expiration (too late)
Loss-to-lease: $24K monthly (residents could get better deals elsewhere)
Application→Lease conversion: 54% (17% below benchmark due to slow approvals)
Action Taken:
Implemented 60-day proactive renewal outreach (vs previous 21-day)
Created tiered renewal offers based on tenant risk profile
Fixed application approval bottleneck (reduced from 5 days to 2 days)
Gradually adjusted below-market units to competitive rates
Added “stay incentives” for high-risk renewals only (targeted vs blanket)
Results After 12 Months:
Renewal rate increased from 60% to 74%
Captured \(18K/month in loss-to-lease (\)216K annually)
Reduced turnover costs by \(89K (14% fewer turns \times \)6,400/turn)
Application→Lease conversion improved to 68%
Vacancy duration dropped from 52 days to 36 days
Total impact: $305K+ additional NOI annually
“We thought we had an occupancy problem. Turns out we had a visibility problem.” — Director of Operations
Key Occupancy Metrics You’ll Track
Technical Integration (Works With Your Stack)
Frequently Asked Questions
Q: How accurate are the renewal risk predictions? A: We use tenure, rent gap to market, payment history, and historical renewal patterns. Most customers report 80%+ accuracy in identifying high-risk renewals.
Q: Can I track multiple properties? A: Absolutely. Compare occupancy metrics across your entire portfolio. Identify which properties excel at renewals, which struggle with conversions, etc.
Q: What if we don’t track lead sources well? A: The dashboard works with whatever data you have. If lead source data is limited, we focus on the conversion stages you can track (applications, showings, leases).
Q: How often does the data update? A: Your choice: real-time sync (for supported systems) or daily batch updates. Loss-to-lease calculations refresh daily based on latest market data.
Q: Does this replace my PMS reports? A: No, it enhances them. Your PMS shows what happened. This dashboard shows what will happen and what you should do about it.
Q: Can I get alerts for specific thresholds? A: Yes. Set custom alerts for vacancy rates, renewal rates, days-vacant, or any metric. Get notified via email or SMS when thresholds are crossed.
Stop Managing in the Dark
Every day without occupancy intelligence means:
Renewals you could have saved but didn’t see coming
Units sitting vacant longer than necessary
Revenue leaking to below-market rents
Conversion problems you can’t diagnose
Pricing decisions based on gut feel, not data
Your competitors are using occupancy analytics. Your market is moving. Your residents have options.
The question isn’t whether you need this visibility.
The question is: How much is not having it costing you right now?
Live demo in 30 minutes • See your actual data • No commitment required
Related Topics
Ready to Get Started?
Schedule a personalized demo to see this dashboard in action.
Schedule Demo Contact Sales