Marketing Intelligence Dashboard
See real-time competitive rents, occupancy, and positioning. Track supply pipeline threats, predict rent growth with ML models, and optimize pricing across submarkets. Most portfolios capture 200-500 bps of additional rent growth ($2M-5M annually on $100M portfolio) through data-driven market strategy.
Getting Started
1️⃣ Connect Your Property Data Link your property management system to pull your rent, occupancy, and unit mix data. This becomes your baseline for competitive comparison.
2️⃣ Define Your Markets & Competitors Identify your submarkets and define your competitive set for each property (typically 5-10 direct competitors per property). We can help with market data subscriptions if needed.
3️⃣ Import Market Data Connect market data sources (CoStar, RealPage Analytics, etc.) or upload rent surveys. Import 24 months of historical data to establish trends.
4️⃣ Configure Supply Pipeline Add known development projects from CoStar, Dodge, or local planning data. Set up alerts for new project announcements in your markets.
5️⃣ Start Optimizing Day one: See where you stand vs. your competitive set. Week one: Identify your biggest pricing opportunities. Month one: Implement data-driven rent adjustments and track results.
Stop Guessing About Your Market: Market Intelligence That Drives Revenue
Know exactly where you stand vs. competitors on rent, occupancy, and amenities. See who’s winning leases and why—adjust pricing and positioning in real-time.
ML-powered rent forecasts show where your submarket is heading in the next 12 months. Stay ahead of supply pipeline threats and concession trends.
Identify submarkets with 8-12% growth potential while others stagnate at 2-3%. Deploy capital where the data says you’ll win—not where you hope you will.
The Market Intelligence Problem Killing Your Revenue
If you’re managing properties across multiple markets, these blindspots are costing you millions annually:
⚠️ Pricing in the dark: Setting rents based on “market feel” or outdated comps from 6 months ago
⚠️ Competitive blindness: No idea what your direct competitors charge, what concessions they’re offering, or how full they are
⚠️ Submarket ignorance: Treating entire MSAs as one market when submarkets vary wildly (one at 95% occupancy, another at 87%)
⚠️ Supply pipeline surprise: New development announced, 850 units delivering in 18 months—now you’re fighting for tenants
⚠️ Concession guessing: Competitors offering 6 weeks free, you’re at 4 weeks—are you leaving money on the table or overpaying?
⚠️ Rent growth mystery: Portfolio average shows 3.5% growth, but which properties drove it? Which are lagging at 1.2%?
⚠️ Amenity gap: Spending $2M on pool renovations when market data shows fitness centers drive 4x more rent premium
⚠️ Acquisition mistakes: Buying properties in “hot markets” that are actually oversupplied and declining
Poor market intelligence = 200-500 basis points of underperformance = \(2M-5M annual loss on a \)100M portfolio. Time to see clearly.
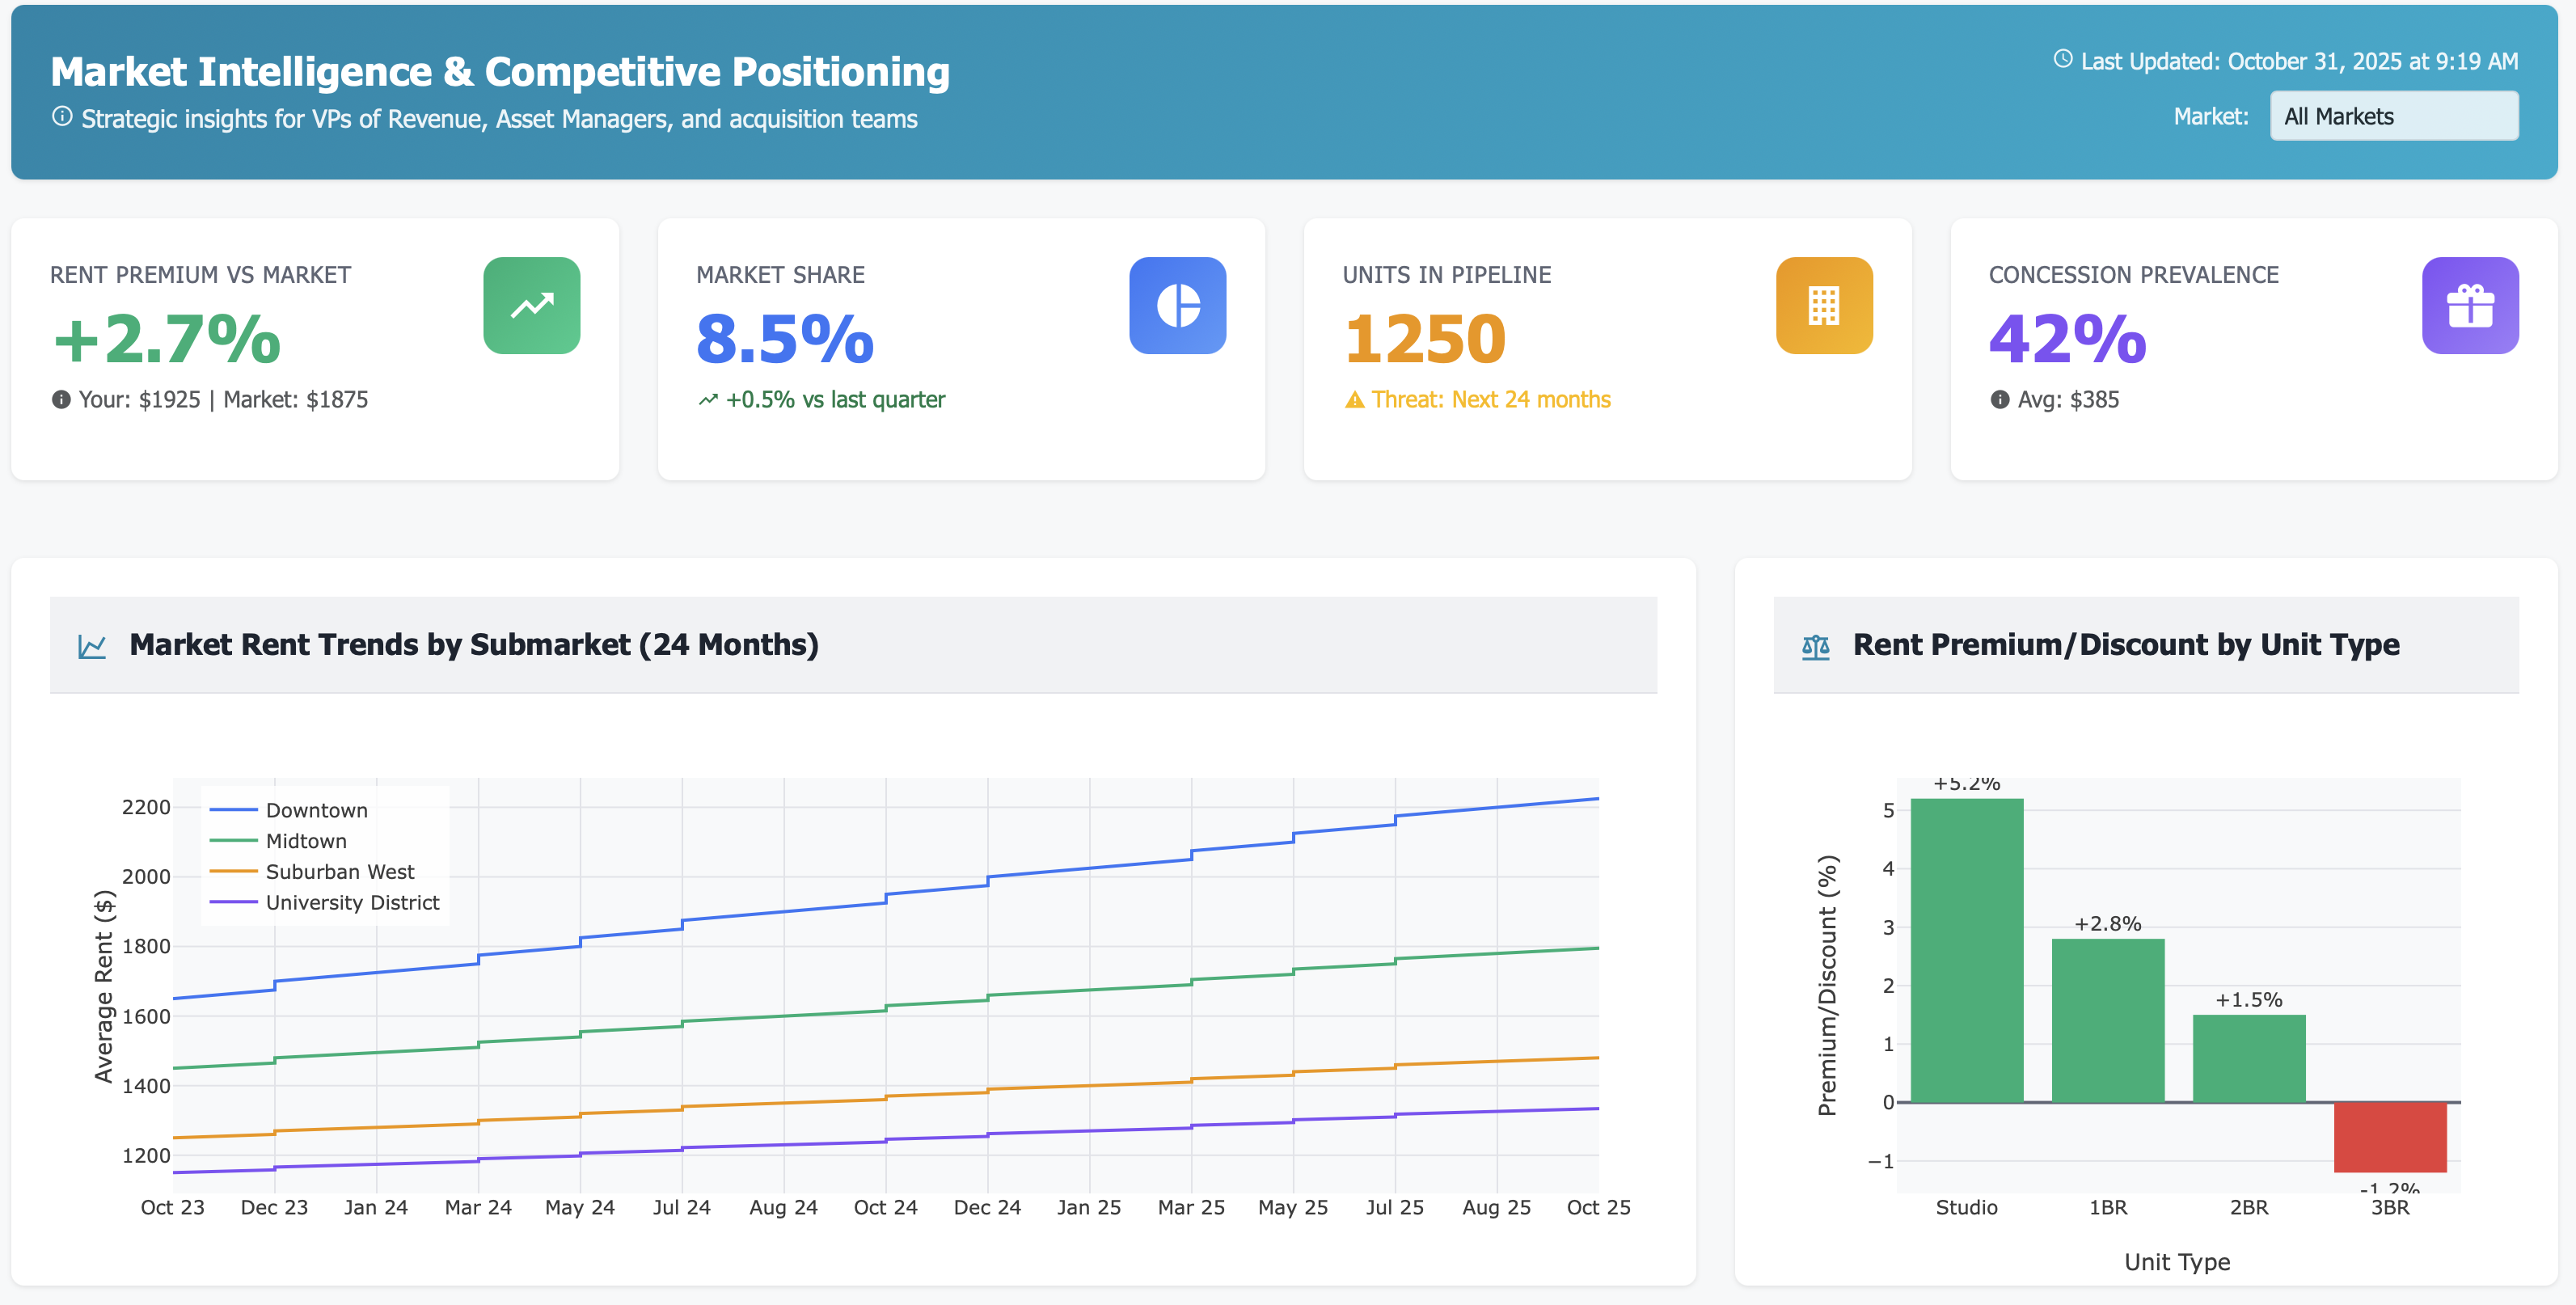
Your New Reality: Complete Market Visibility
Market Rent Trends by Submarket
Know which submarkets are winning:
Downtown Core: $2,450/unit, +8.2% YoY (hot)
University District: $1,875/unit, +11.5% YoY (explosive)
Suburban West: $1,950/unit, +2.1% YoY (cooling)
Airport Corridor: $1,725/unit, -1.8% YoY (declining)
See the future before your competitors do
Competitive Positioning Matrix
Understand your competitive position:
Your properties: How you stack up on rent vs. occupancy
Direct competitors: Who’s charging more with higher occupancy? (They’re winning)
Market sweet spot: Where should you be positioning?
Outliers: Properties priced wrong for their quality
Compete with data, not hunches
Supply Pipeline by Submarket
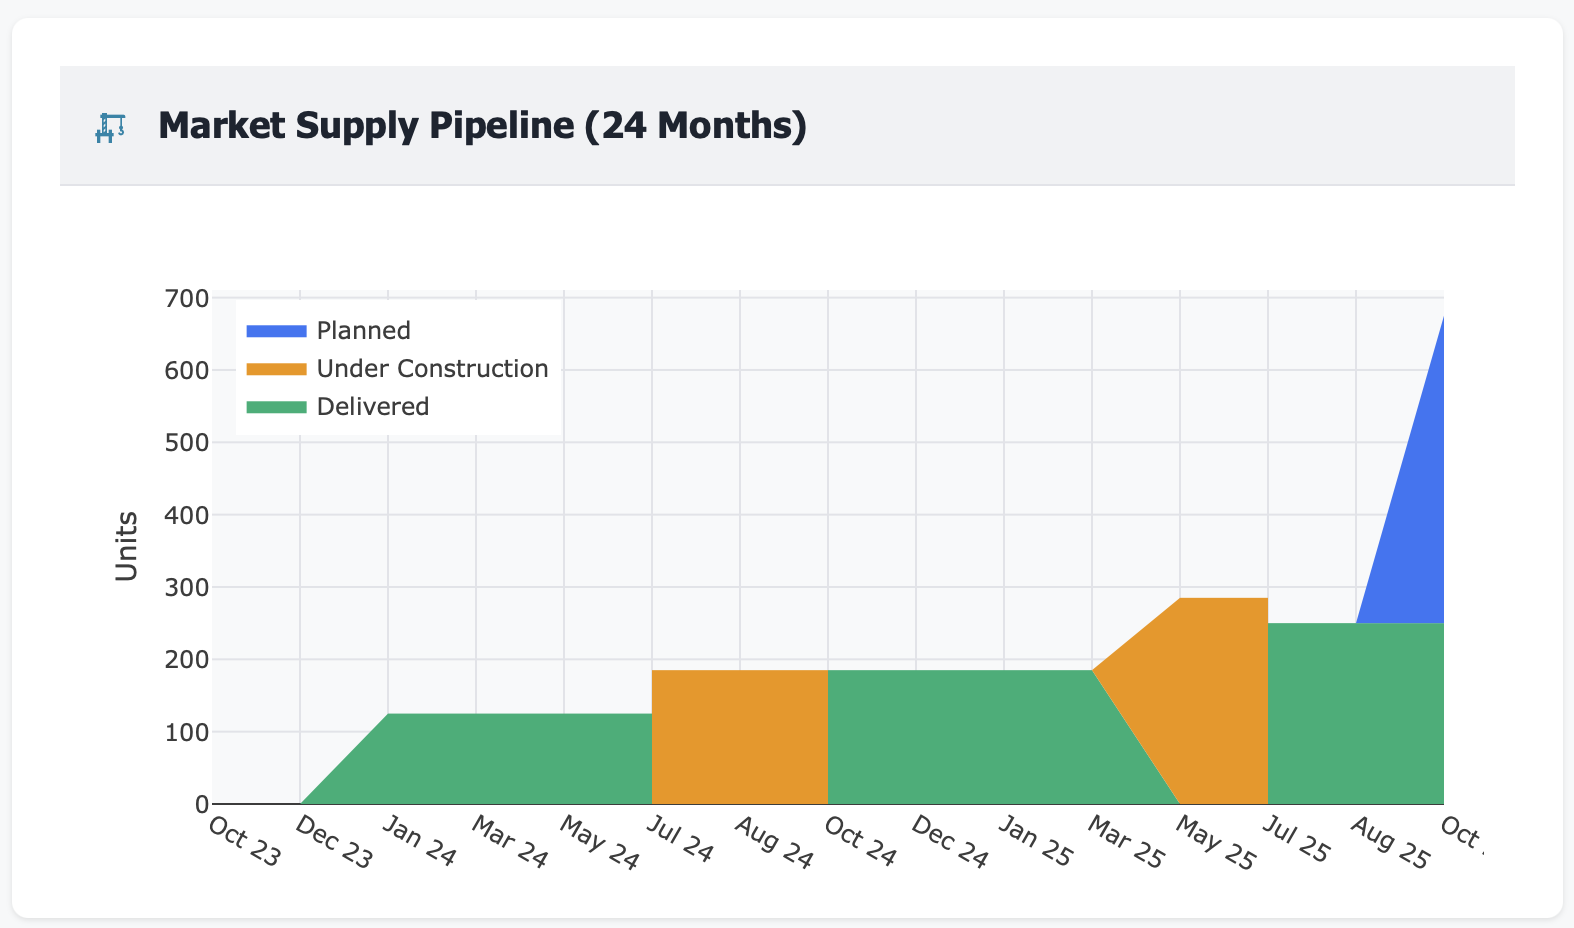
Avoid supply shocks:
Q2 2025: 1,250 units delivering (prepare now)
Q4 2025: 2,850 units delivering (major threat)
Q2 2026: 4,100 units delivering (catastrophic if unprepared)
Your exposure: Which of your properties face the most competition?
Proactive strategy beats reactive panic
Real Results: From Market Blindness to Revenue Mastery
Metric |
Before Market Intelligence |
After 12 Months |
|---|---|---|
Rent growth (portfolio avg) |
3.2% (guessing) |
6.8% (data-driven) |
Occupancy (portfolio avg) |
91.5% (inconsistent) |
94.2% (optimized) |
Rent premium vs market |
-2.5% (leaving money) |
+3.8% (commanding premium) |
Time to identify threats |
4-6 months (too late) |
Real-time (proactive) |
Pricing adjustments/year |
4 (reactive, slow) |
24+ (agile, data-driven) |
Concession cost efficiency |
Unknown effectiveness |
35% reduction in cost |
Bad acquisitions avoided |
0 (flew blind) |
2 deals killed ($45M saved) |
Revenue captured |
— |
$4.2M across 12-property portfolio |
Features That Transform Market Strategy
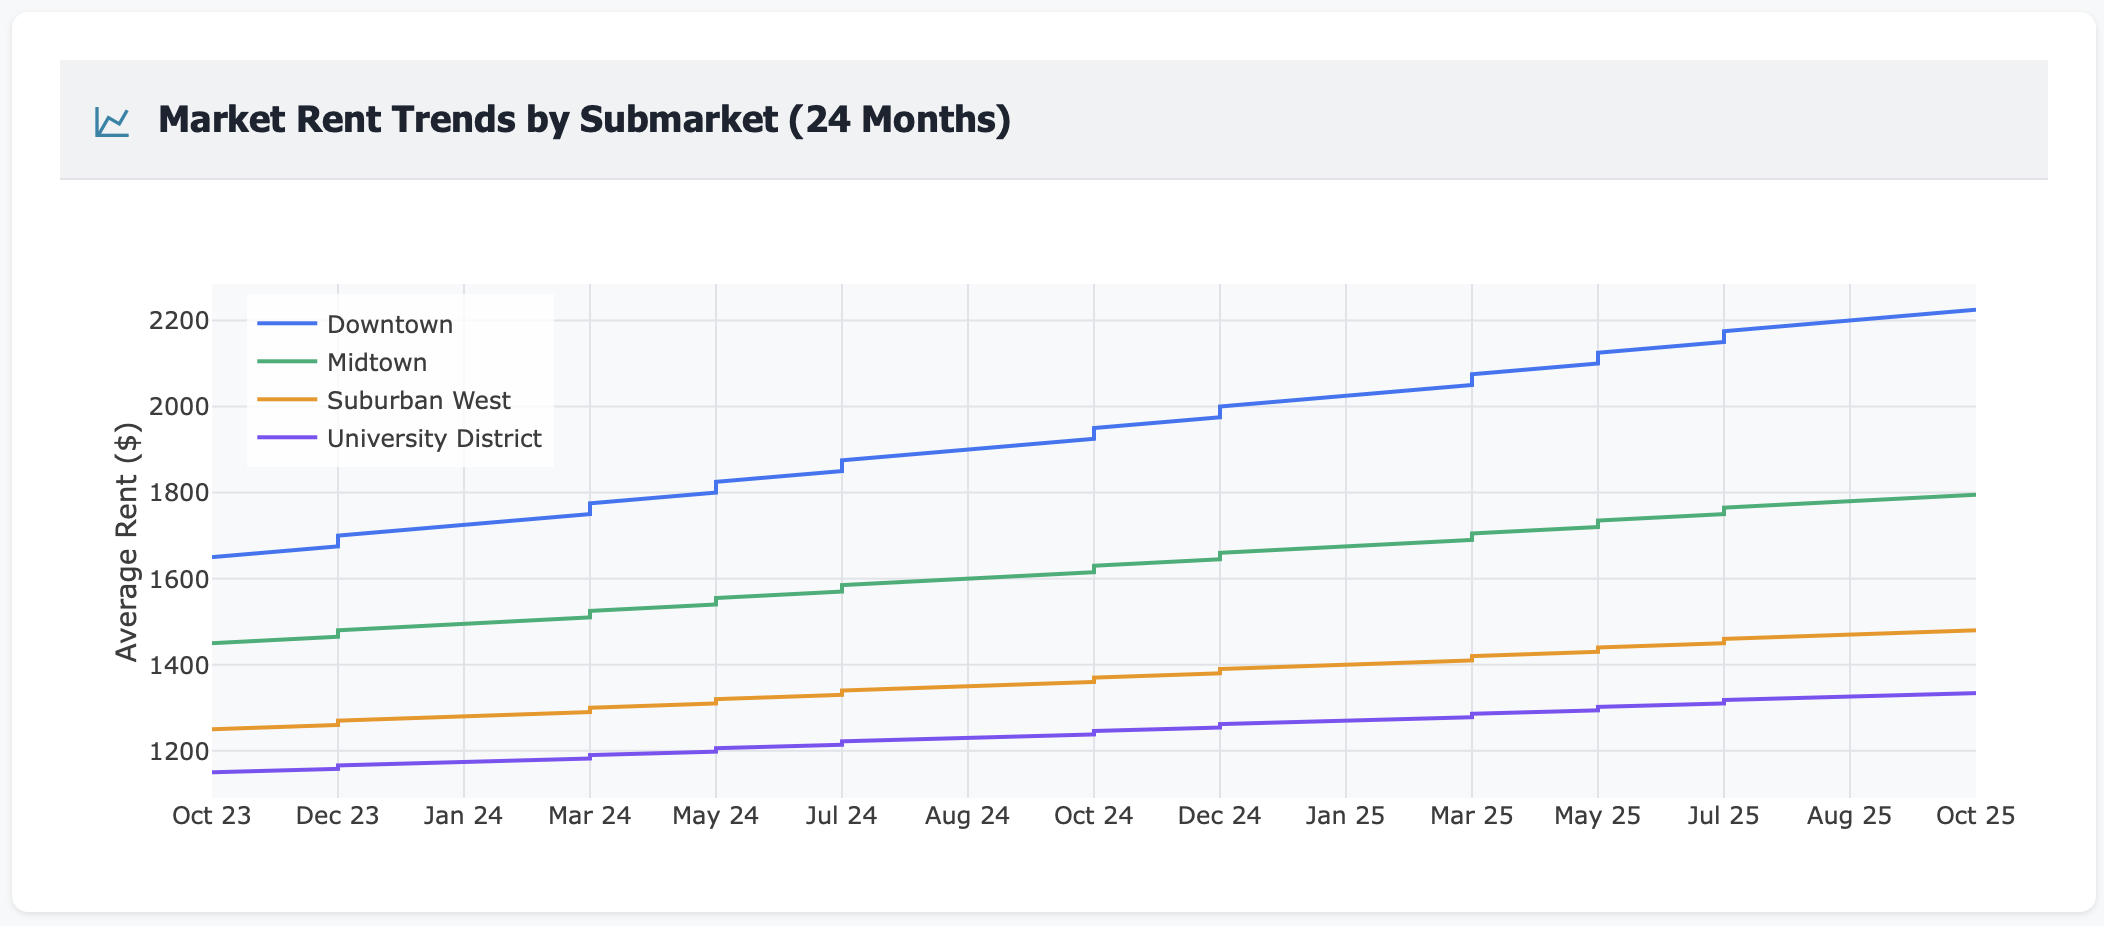
📊 Submarket Rent Trends (24-Month View)
Track rent movements across every submarket you operate in. See which areas are accelerating, which are plateauing, and which are declining—month by month, unit type by unit type.
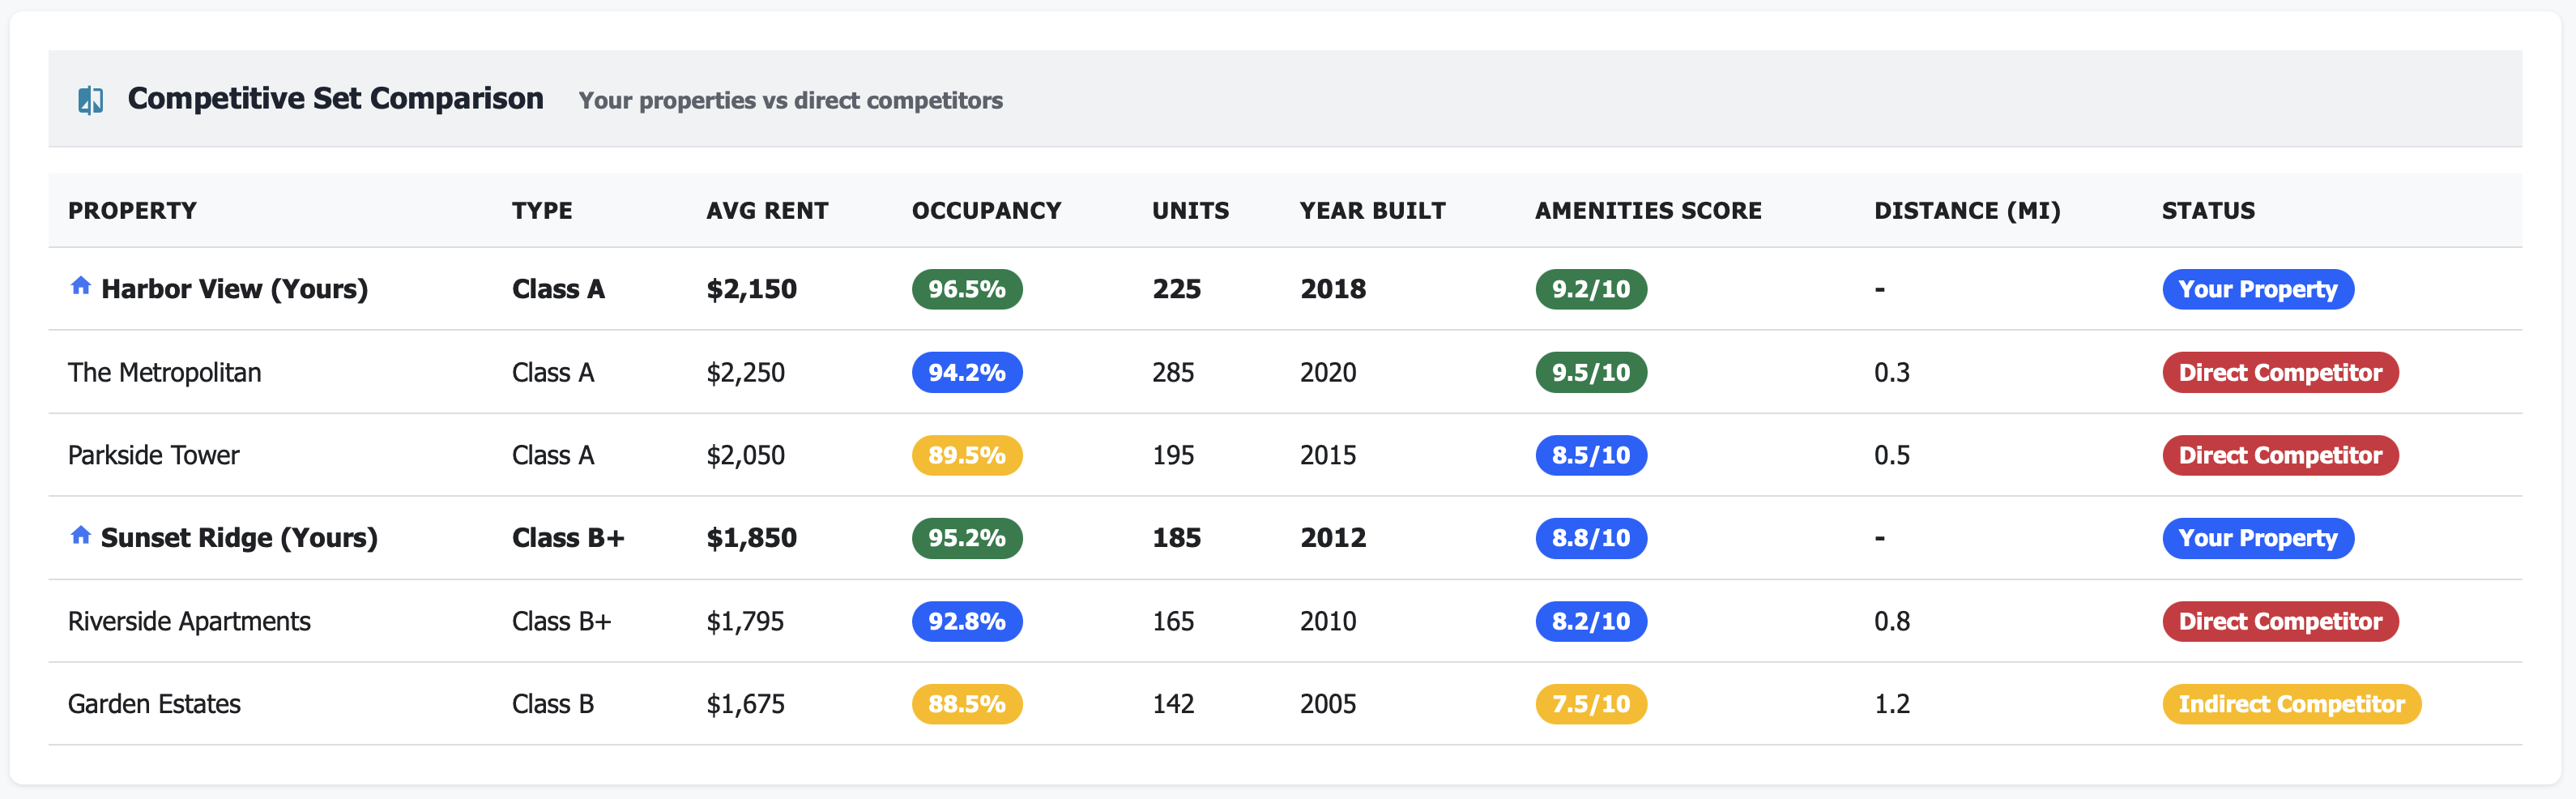
🏢 Competitive Set Analysis
See your direct competitors’ rents, occupancy, amenities, and positioning. Know exactly where you stand. Update weekly with fresh data from market surveys and public sources.
🚧 Supply Pipeline Monitor
See every project under construction or planned within your markets. Know delivery dates, unit counts, and expected impact on your properties. Plan rent strategy 12-24 months ahead.
📈 ML-Powered Rent Growth Forecasts
Machine learning models analyze 50+ market variables to predict rent growth by submarket for the next 12 months. See upper and lower confidence bands—understand the range of outcomes.
🎁 Concession Prevalence Tracker
Track what percentage of competitors are offering concessions, average concession size, and seasonal patterns. Know when to compete on concessions vs. when to hold firm on rent.
🎯 Amenity Benchmarking
Compare your amenity package to competitors. See which amenities drive rent premiums (fitness centers, parking, in-unit W/D) vs. which don’t (business centers, clubhouses).
📍 Property-Level Market Position
For each property, see your position vs. the submarket average and vs. your competitive set. Identify over-performers and under-performers. Understand which properties have pricing power.
🔮 Absorption Rate Analysis
Track how quickly new supply gets absorbed in each submarket. High absorption = healthy market. Low absorption = oversupply risk. Adjust your strategy before the market turns.
📉 Occupancy Gap Analysis
See the spread between your occupancy and market occupancy. Are you underperforming at 88% when the market is at 93%? Fix pricing or operations. Overperforming at 96% when market is at 90%? Raise rents.
💵 Effective Rent vs. Asking Rent
Track the difference between asking rent and effective rent (after concessions). Know your true revenue per unit vs. your sticker price. See which competitors are hiding behind big concessions.
Perfect For
VPs of Revenue
Make data-backed pricing decisions, optimize rent growth across the portfolio, and know exactly when to push rates vs. when to protect occupancy
Asset Managers
Monitor property performance vs. market benchmarks, identify underperformers, and build investment cases backed by real market data
Acquisitions Teams
Evaluate markets and submarkets with precision, avoid oversupplied areas, and underwrite deals based on actual market trajectories—not broker hype
Use Case: Capturing $4.2M Through Submarket Intelligence
Real Customer Story
Challenge: A 12-property, 2,850-unit portfolio across 3 MSAs had no systematic market intelligence. Pricing decisions were based on gut feel and lagging comps. Some properties underperformed while others left money on the table. Portfolio average rent growth: 3.2%.
Dashboard Revealed:
Submarket performance varied wildly: +11.5% in one area, -1.8% in another
5 properties were priced 4-8% below direct competitors with similar amenities
3 properties were overpriced for their submarket, sitting at 87-89% occupancy
Supply pipeline: 4,100 units delivering in 18 months near 2 properties
Concession data: Portfolio offering 6 weeks free when market average was 4 weeks
Amenity gap: Spending on clubhouses when fitness centers drove 3x the rent premium
One property in “hot market” was actually in declining submarket (-1.8% rents)
Rent growth forecast: 2 submarkets showed 9-12% growth potential over next 12 months
Action Taken:
Aggressive rent push in high-growth submarkets: Increased rents 8-10% in University District and Tech Corridor properties (forecast showed market could absorb it)
Pricing correction on underpriced properties: Raised rents 5-7% on properties that were 4-8% below comps with better amenities
Occupancy recovery on overpriced properties: Reduced rents 3-4% on 3 properties sitting at 87-89% occupancy, brought them to 94-95%
Preemptive supply response: For 2 properties facing new supply, implemented 12-month lease incentives and loyalty programs before competition arrived
Concession optimization: Cut standard concessions from 6 weeks to 4 weeks (market level), saved $285K annually while maintaining lease velocity
Amenity reallocation: Killed \(1.2M clubhouse renovation, invested \)850K in fitness center upgrades (data showed 3x higher rent premium)
Acquisition strategy shift: Avoided buying 2 properties in “hot” markets that data showed were oversupplied and declining
Dynamic pricing by unit type: Implemented unit-type-specific pricing based on submarket supply/demand (Studios +12%, 3BR +4%)
Results After 12 Months:
Portfolio rent growth: 6.8% (up from 3.2%, 112% improvement)
Portfolio occupancy: 94.2% (up from 91.5%, 2.7 points)
Rent premium vs market: +3.8% (up from -2.5%, 6.3 point swing)
High-growth properties: 9.5% rent growth (vs 3.2% before)
Recovered properties: 89% → 95% occupancy (6 points)
Concession savings: $285K annually
Bad acquisitions avoided: $45M in properties that would have underperformed
Amenity ROI improvement: 3x higher rent lift per dollar spent
Total revenue impact: $4.2M annually
Effective rent per unit: +$148/month across portfolio
“We thought we knew our markets. The dashboard showed us we were flying blind—underpricing here, overpricing there, and missing the real growth opportunities.” — VP of Revenue, Multifamily REIT
Key Market Metrics You’ll Track
Technical Integration (Works With Your Stack)
Frequently Asked Questions
Q: How current is the market data? A: Your property data updates daily. Competitive rent data updates weekly (or as often as you survey). Supply pipeline data updates monthly or when new projects are announced.
Q: Where does competitive data come from? A: Multiple sources: market data subscriptions (CoStar, RealPage), your own rent surveys, public listings, and website scraping (where legally permitted). You control the sources.
Q: Can I see unit-type-specific competitive data? A: Yes. Compare your 1BR rents to market 1BR rents, 2BR to 2BR, etc. See which unit types you’re over/underpriced on.
Q: How accurate are the rent growth forecasts? A: ML models trained on 5+ years of historical data, 50+ variables per submarket. Historical accuracy: ±2-3% on 12-month forecasts. Confidence bands show the range of likely outcomes.
Q: What if I operate in multiple MSAs? A: No problem. Add as many markets and submarkets as you operate in. Each gets its own trends, forecasts, and competitive analysis.
Q: Can I track concession effectiveness? A: Yes. See which concessions drive leases vs. which just give away money. Track concession cost as percentage of effective rent.
Q: How do I know which amenities matter? A: The dashboard shows rent premiums by amenity type based on market comp data. See which amenities command higher rents in your specific submarkets.
Q: Can I use this for acquisitions due diligence? A: Absolutely. Evaluate any property’s market position, submarket trends, supply pipeline risk, and rent growth potential before you buy.
Stop Leaving Money on the Table
Every month without market intelligence means:
Pricing properties wrong—too high (vacancy loss) or too low (revenue loss)
Missing rent growth opportunities in high-performing submarkets
Getting blindsided by new supply that erodes your occupancy
Competing on concessions when you should hold firm on rent
Making acquisition decisions based on outdated or incomplete market views
Spending capex on amenities that don’t drive rent premiums
Your best-performing competitors have market intelligence dashboards. You’re competing against their data with your gut.
The question isn’t whether you need market intelligence.
The question is: How much revenue are you leaving on the table right now?
Related Topics
Ready to Get Started?
Schedule a personalized demo to see this dashboard in action.
Schedule Demo Contact Sales