Investor's Relations Dashboard
Eliminate quarterly reporting chaos with institutional-grade investor relations automation. Auto-generate reports in hours (not days), track lease rollover risk 18 months ahead, visualize distribution waterfalls with perfect accuracy, and give LPs self-service access to performance data. Reduce reporting time by 90% and LP inquiries by 60-80% while building confidence for your next raise.
Getting Started
1️⃣ Connect Your Systems Link your property management system and accounting platform. We’ll import current property performance, financials, and lease data.
2️⃣ Configure Your Waterfall Define your fund’s distribution waterfall structure—preferred returns, GP/LP splits, promote tiers. We support any waterfall structure, no matter how complex.
3️⃣ Import Historical Data Upload 3-5 years of historical distributions, property performance, and investor reports. This enables YoY comparisons and trend analysis from day one.
4️⃣ Set Up LP Portal Add your investors to the system with secure logins. Define what each investor class can see (some funds have different reporting for different LP tiers).
5️⃣ Generate First Report Day one: Generate your first automated quarterly report. Review for accuracy, make any template adjustments. Quarter two: Click button, report is done.
Transform Investor Relations from Quarterly Chaos to Continuous Confidence
Auto-generate investor reports in minutes, not days. Track every metric investors care about in real-time—no more scrambling before board meetings.
See lease rollover risk 18 months ahead. Know exactly which properties face renewal cliffs, calculate exposure, and communicate plans before investors ask.
Show investors exactly how every dollar flows through the waterfall—from revenue to distributions. Eliminate “when do we get paid?” questions with crystal-clear visibility.
The Investor Relations Problem Destroying Trust
If you’re managing investor capital across properties, these problems are costing you credibility (and capital):
⚠️ Quarterly report hell: 3-5 days building investor reports from scratch every quarter—pulling data from 6 systems, making Excel match
⚠️ Performance comparison blindness: No easy way to show YoY, QoQ, or property-to-property performance—investors ask, you scramble
⚠️ Lease rollover surprise: 40% of leases expire in Q3—you didn’t see it coming, investors aren’t happy
⚠️ Distribution waterfall confusion: Investors don’t understand when they get paid or why distributions vary—constant emails and calls
⚠️ Metric inconsistency: Reporting different metrics in different ways across quarters—investors notice, trust erodes
⚠️ Manual calculation errors: One wrong formula in Excel, now your IRR is off by 200 bps and you’re explaining in front of the board
⚠️ No forward visibility: Reporting what happened last quarter, but investors want to know what’s coming next 6 quarters
⚠️ Investor portal chaos: PDFs in email, Dropbox folders, “where’s Q2 2023 report?”—no centralized access
Poor investor relations = delayed fundraising, redemption requests, reputation damage, and difficulty raising the next fund. Time to professionalize it.
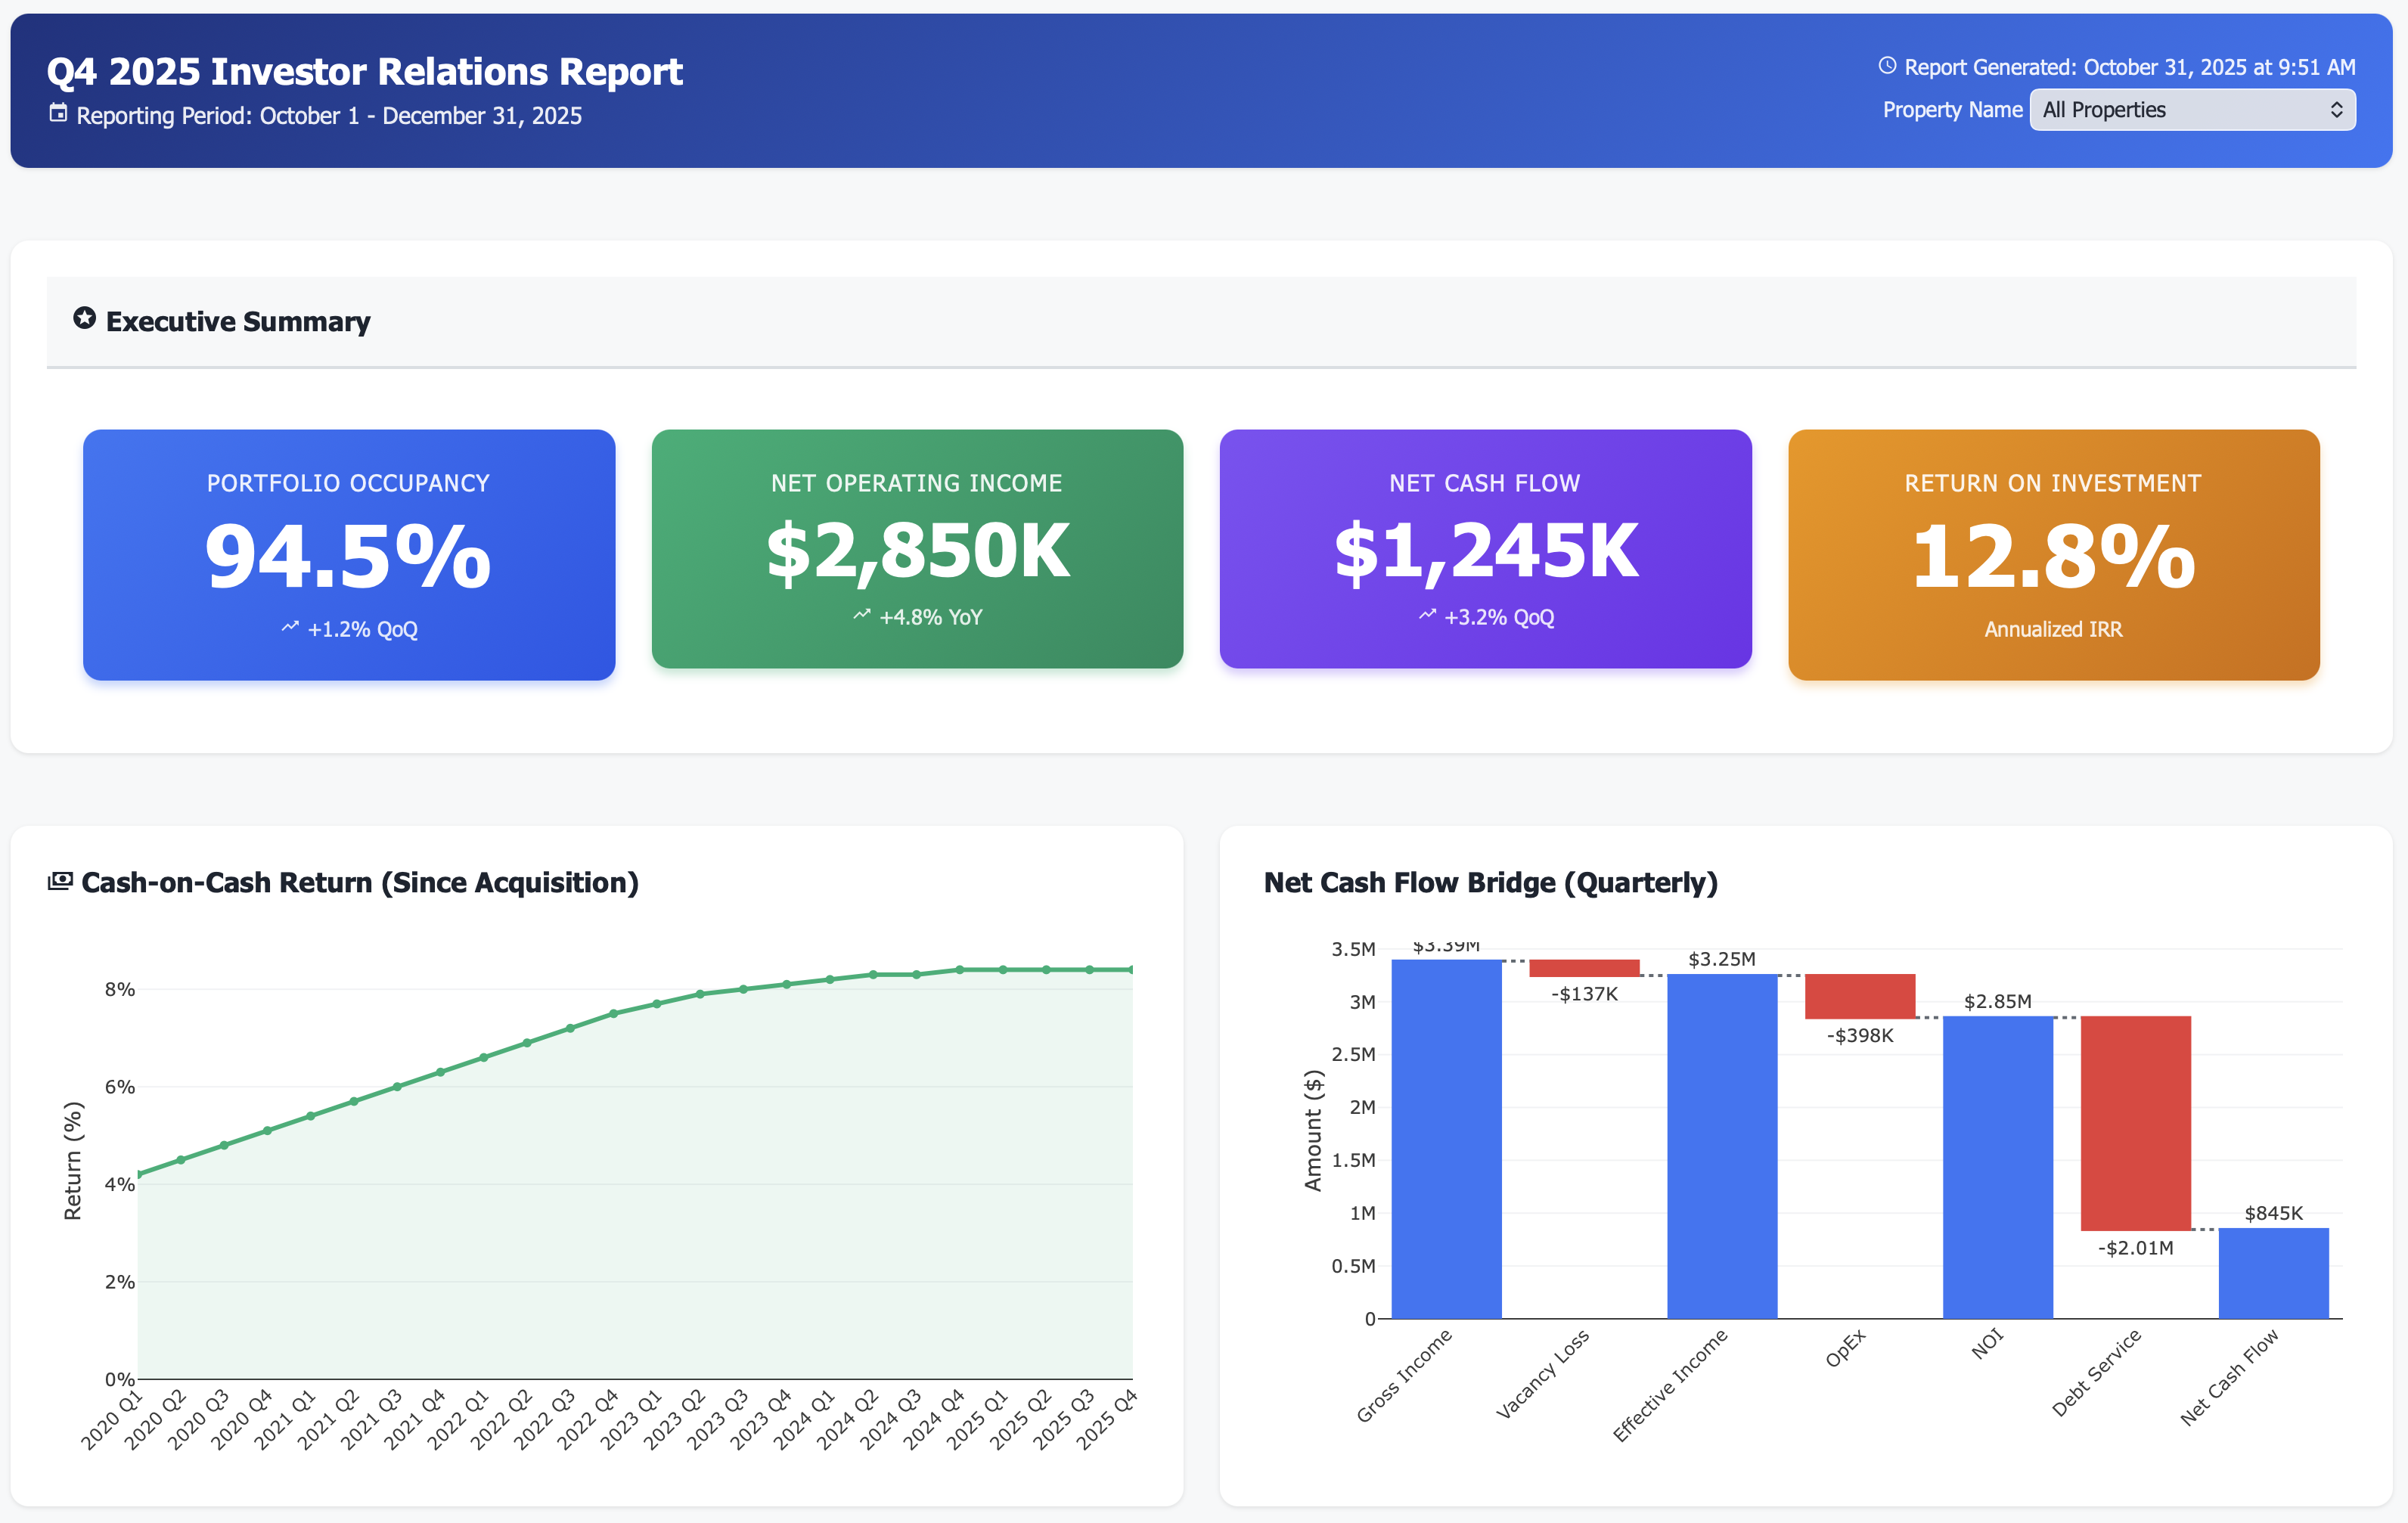
Your New Reality: Institutional-Grade Investor Reporting
Lease Rollover Risk Analysis
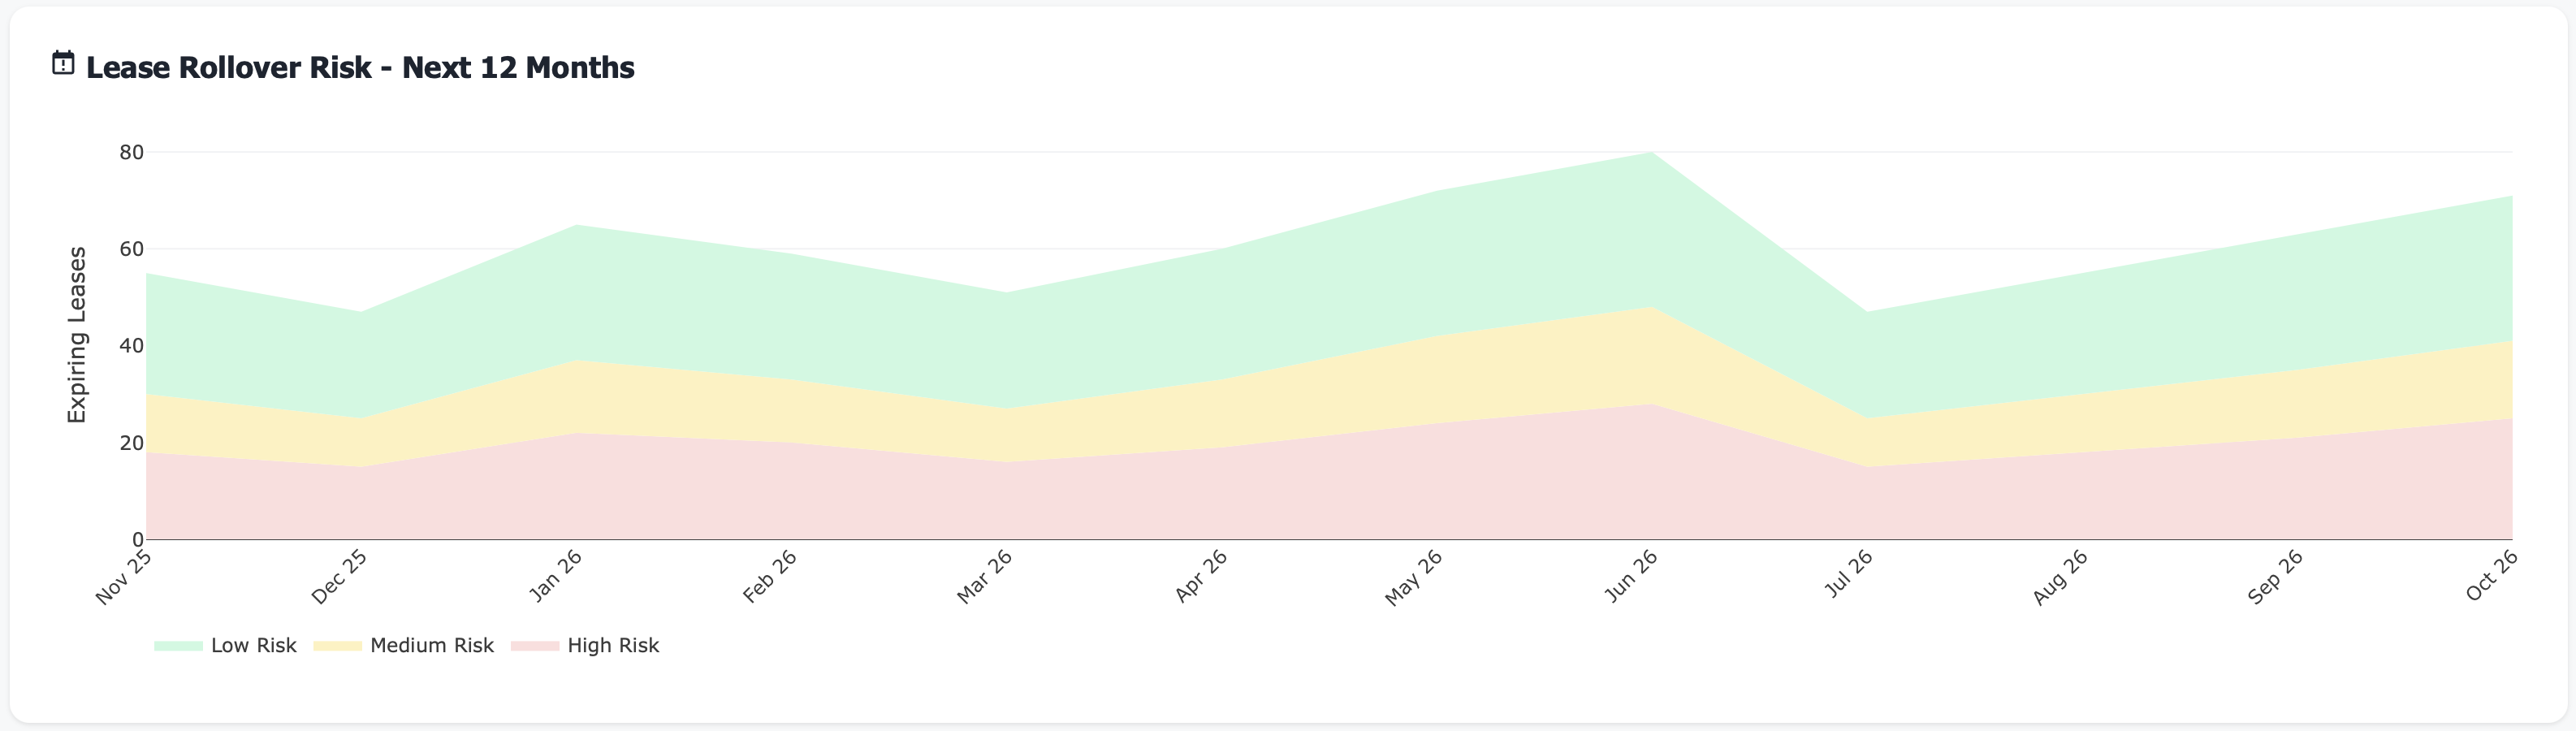
See renewal risk before it hits:
Q1 2026: 125 leases expiring ($281K monthly revenue at risk)
Q2 2026: 89 leases expiring ($198K monthly revenue)
Q3 2026: 203 leases expiring ($445K monthly revenue - CLIFF!)
Q4 2026: 142 leases expiring ($315K monthly revenue)
Proactive planning beats reactive crisis management
Year-Over-Year Performance Comparison
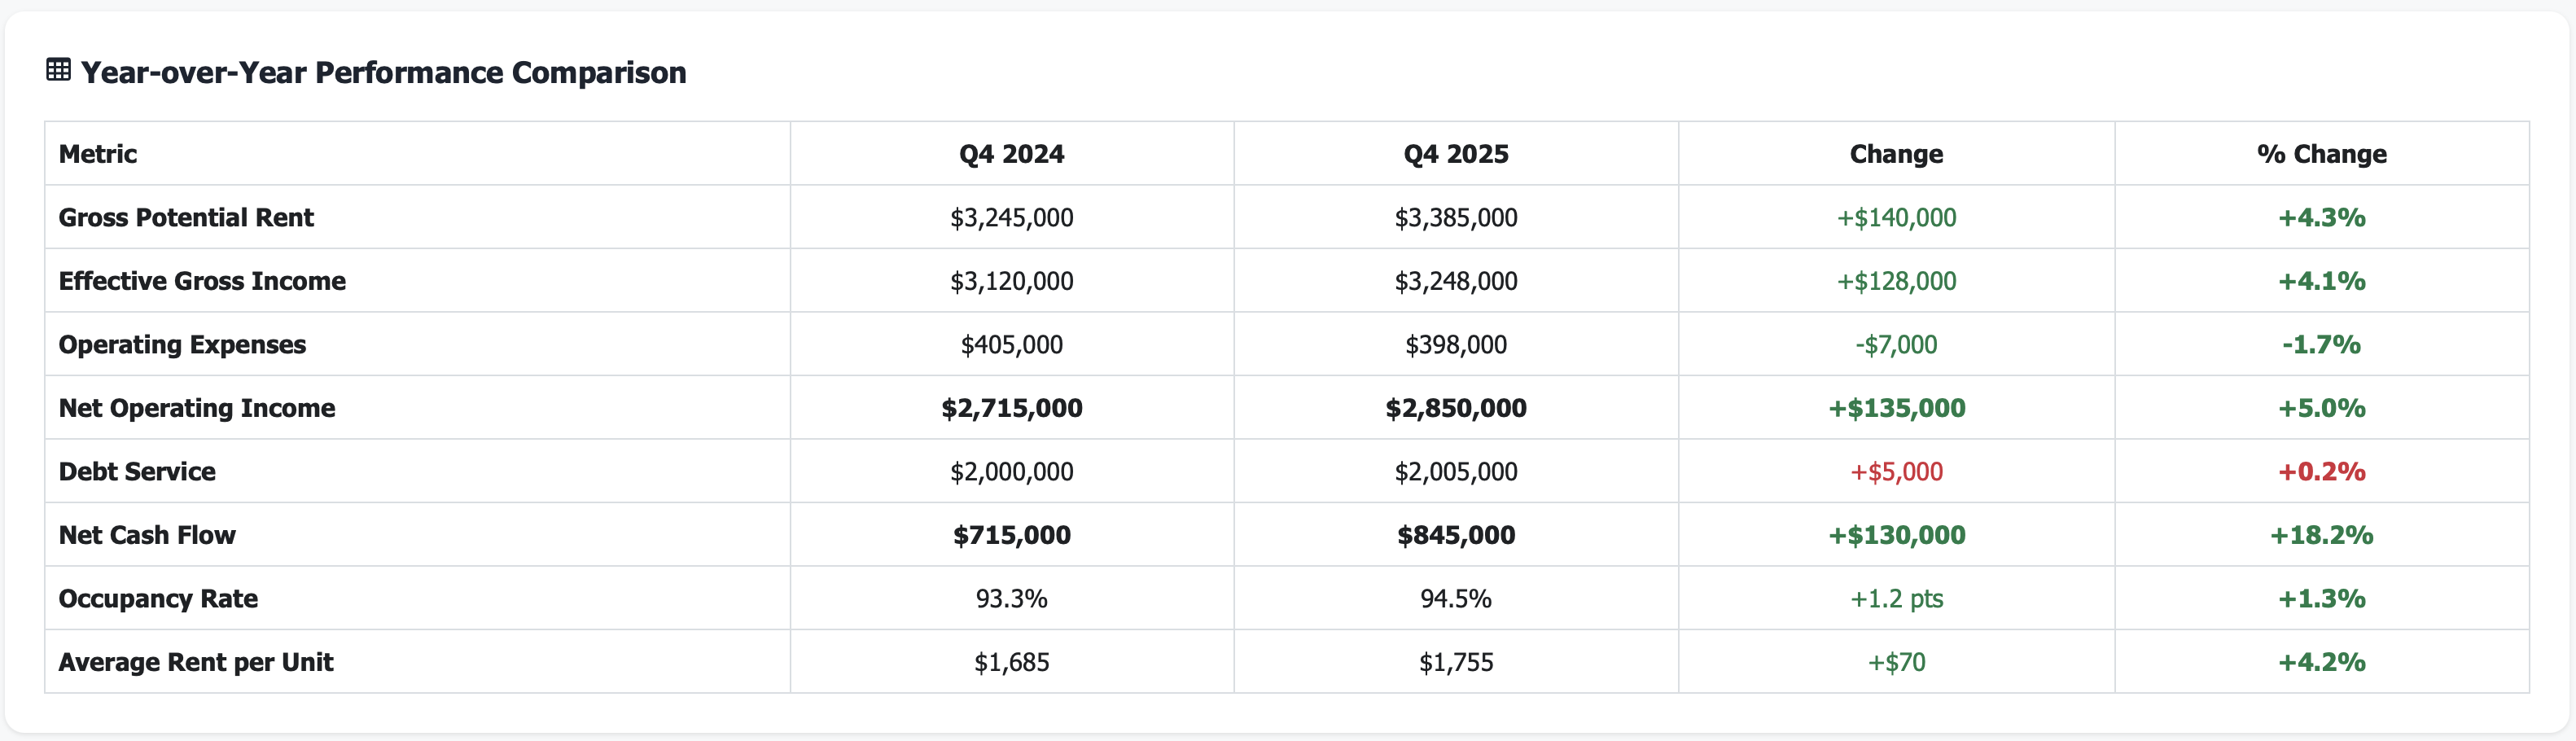
Show investors the trajectory:
Harbor View: NOI +12.5% YoY (outperforming)
Sunset Ridge: NOI +8.2% YoY (on target)
Riverside Commons: NOI +3.1% YoY (underperforming)
Portfolio: NOI +7.8% YoY (beating projections)
Transparency builds confidence
Distribution Waterfall Visualization
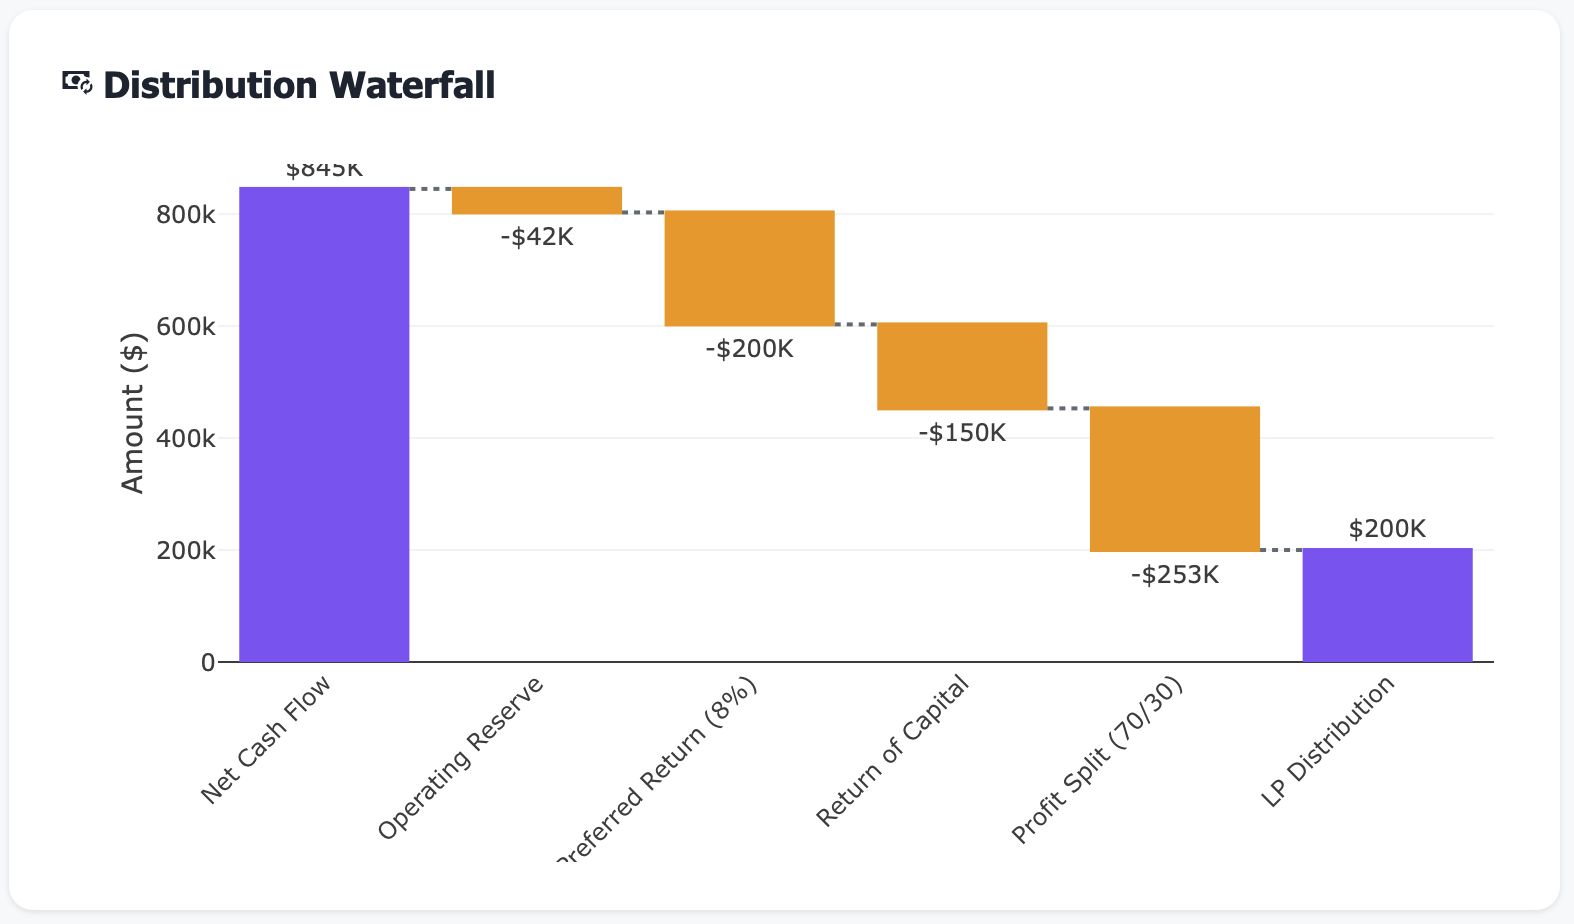
Eliminate waterfall confusion:
Gross Revenue: $12.5M
Operating Expenses: -$5.2M
NOI: $7.3M
Debt Service: -$3.8M
Cash Flow Before Distributions: $3.5M
Preferred Return (8%): $960K → Investors
GP/LP Split (80/20 after pref): \(2.54M \rightarrow \)508K GP, $2.03M LP
Promote (20% catch-up): Tier calculations shown
Every investor sees exactly where their money goes
Real Results: From Reporting Chaos to Investor Confidence
Metric |
Before IR Dashboard |
After 12 Months |
|---|---|---|
Quarterly report prep time |
3-5 days (manual chaos) |
2 hours (automated) |
Investor inquiry volume |
45-60 per quarter |
8-12 per quarter (80% reduction) |
Reporting errors/corrections |
3-4 per year (embarrassing) |
0 (single source of truth) |
Distribution calculation time |
4-6 hours (manual Excel) |
Instant (automated) |
Lease rollover visibility |
1 quarter ahead (reactive) |
18+ months ahead (proactive) |
Time to investor questions |
2-3 days average |
Same day (self-service portal) |
LP satisfaction score |
7.2/10 (acceptable) |
9.1/10 (excellent) |
Next fund raise timeline |
8 months (slow momentum) |
4 months (strong confidence) |
Features That Transform Investor Relations
📊 Automated Quarterly Reports
Generate professional investor reports with one click. All metrics updated automatically from your property management system. Consistent formatting, accurate calculations, delivered on time—every quarter.
📅 Lease Rollover Risk Dashboard
See all lease expirations for the next 18-24 months. Visualize renewal cliffs by property, by quarter, by revenue impact. Calculate retention rate assumptions and model revenue risk scenarios.
📈 Year-Over-Year Performance Tracking
Compare every metric YoY and QoQ:
Revenue: Actual vs Budget vs Prior Year
NOI: By property, by quarter, by year
Occupancy: Trends and comparisons
Rent Growth: Actual vs market vs projections
Operating Expenses: Category-by-category variance analysis
Show the story, not just the numbers.
💰 Distribution Waterfall Calculator
Automatically calculate distributions based on your fund’s waterfall structure:
Preferred return tracking (8%, 10%, whatever you’ve structured)
GP/LP splits by tier
Promote calculations (catch-up, carried interest)
Historical distribution tracking
Projected distribution forecasting
No more Excel errors or waterfall confusion.
🏢 Property-Level Performance Cards
For each property, show investors:
Current occupancy vs target
Rent vs market comps
NOI vs budget ($ and %)
Cap rate and cash-on-cash return
Occupancy trend (12-month)
Upcoming lease expirations
Recent capex and maintenance
Property-by-property transparency.
📉 Variance Analysis (Budget vs Actual)
Automatically calculate and visualize variances:
Revenue: Why are we 3% above budget?
Operating expenses: Why is maintenance 8% over?
NOI: Breaking down the drivers of outperformance/underperformance
Answer “why?” before investors ask.
🎯 KPI Tracking Dashboard
Track the metrics institutional investors care about:
EBITDA and NOI margins
Debt service coverage ratio (DSCR)
Loan-to-value (LTV)
Cash-on-cash return
IRR (actual vs projected)
Equity multiple projections
Institutional-grade metrics, automatically calculated.
📱 LP Self-Service Portal
Give each investor secure access to:
Their investment summary and ownership %
Historical distributions received
Quarterly reports (all quarters, always accessible)
Property-level performance data
Distribution projections
Tax documents (K-1s, etc.)
Reduce inquiry volume by 60-80%.
🔮 Forward-Looking Projections
Don’t just report history—show the future:
12-18 month revenue projections by property
Lease rollover impact modeling
Distribution forecasts (next 4 quarters)
Exit scenario modeling (3-year, 5-year, 7-year holds)
Forward visibility = investor confidence.
📧 Automated Investor Updates
Schedule automated monthly or quarterly updates:
Performance summary email
Key metric alerts (occupancy drops, large expenses)
Upcoming lease rollover notices
Distribution announcements
Proactive communication without manual work.
📊 Fund-Level Consolidated View
For sponsors managing multiple funds:
See all funds on one dashboard
Compare fund performance
Track capital deployment
Monitor fund-level returns
Aggregate LP reporting
Portfolio-level visibility.
🗂️ Document Management
Centralized storage for:
Quarterly reports (every quarter, every fund)
Operating agreements and PPMs
Property financials
Board presentations
K-1s and tax documents
Everything in one place, always accessible.
Perfect For
Fund Managers / GPs
Streamline quarterly reporting, reduce LP inquiries, demonstrate professional fund management, and raise capital faster through institutional-grade transparency
Asset Managers
Track property performance vs projections, identify underperformers early, model lease rollover risk, and prepare data-driven board presentations
CFOs / Controllers
Automate distribution calculations, eliminate Excel errors, ensure waterfall accuracy, and reduce quarter-end close time by 60-80%
Use Case: From 5-Day Reporting Sprint to 2-Hour Automation
Real Customer Story
Challenge: A private equity real estate fund with 8 properties ($185M AUM) spent 3-5 days every quarter building investor reports manually. Performance data came from Yardi, financials from QuickBooks, lease data from spreadsheets. Frequent calculation errors, inconsistent reporting, and 50+ LP inquiries per quarter asking “when’s my next distribution?” or “how’s Harbor View performing?”
Dashboard Revealed:
Quarterly reporting process: 3-5 days (one person full-time)
Investor inquiries: 52 in Q4 2024 (8-10 hours responding)
Distribution calculation errors: 2 errors in prior 12 months (required correction notices)
Lease rollover visibility: Only tracking current quarter expirations
YoY comparison: Required 6 hours of manual Excel work per report
LP portal: None—emailing PDFs to 34 investors individually
Reporting inconsistency: Different metrics emphasized in different quarters
Forward projections: Rarely included, always manual when requested
Action Taken:
System integration: Connected Yardi (property management), QuickBooks (accounting), and uploaded historical distribution data
Waterfall configuration: Programmed the fund’s waterfall structure (8% pref, 80/20 split, 20% promote after catch-up)
Report template creation: Built quarterly report template with all standard sections, auto-populated with live data
LP portal launch: Gave all 34 LPs secure login access to view performance data, distributions, and reports
Lease rollover tracking: Imported all lease data, set up 18-month forward visibility with revenue impact calculations
KPI dashboard: Configured all institutional metrics (DSCR, LTV, IRR, cash-on-cash) to auto-calculate
Automated email updates: Monthly performance summary emails to all LPs (no manual work)
Historical data import: Uploaded 3 years of historical data for YoY comparisons and trend analysis
Results After 12 Months:
Quarterly report prep time: 2 hours (down from 3-5 days, 95% reduction)
Staff time recovered: 120 hours per year
Investor inquiry volume: 11 in Q4 2025 (down from 52, 79% reduction)
Distribution calculation errors: 0 (down from 2, 100% improvement)
Lease rollover surprise: Identified Q3 2026 cliff (203 lease expirations) 15 months early, implemented proactive retention campaign
LP satisfaction score: 9.1/10 (up from 7.2/10)
Self-service portal adoption: 28 of 34 LPs (82%) regularly check portal
Time to investor questions: Same day (down from 2-3 days)
Next fund raise: $240M raised in 4 months (vs 8 months for prior fund)
Fundraising attributed to professional reporting: 6 new LPs specifically cited “transparency and professionalism”
“Our LPs kept comparing us unfavorably to larger institutional managers. Now our reporting looks just as professional—and we do it in 2 hours instead of 5 days.” — Managing Partner, PE Real Estate Fund
Key Investor Metrics You’ll Track
Technical Integration (Works With Your Stack)
Frequently Asked Questions
Q: Can you handle complex waterfall structures? A: Yes. We support: multiple preferred return tiers, catch-up provisions, carried interest, deal-by-deal vs fund-level promotes, European waterfalls, and hybrid structures. If you can describe it, we can calculate it.
Q: How do you track lease rollover risk? A: We import all lease expiration dates from your property management system. The dashboard automatically calculates expirations by month/quarter, shows revenue at risk, and tracks historical retention rates to model likely renewals.
Q: Can I create custom reports for different LP types? A: Yes. Create templates for different investor classes—institutional LPs might get 40-page reports with deep analysis, smaller LPs might get 8-page summaries. Same data, different presentation.
Q: What if we have multiple funds? A: Each fund gets its own dashboard with its own waterfall structure, LPs, and properties. You can also see a consolidated view across all funds for portfolio-level reporting.
Q: Can LPs download reports themselves? A: Yes. The LP portal lets investors download current and historical quarterly reports, view real-time performance data, and access tax documents—all without emailing you.
Q: How do you handle mid-year acquisitions or dispositions? A: The system tracks property ownership periods and prorates calculations. Add/remove properties at any time, and all reports adjust automatically.
Q: Can I model different exit scenarios? A: Yes. Run IRR projections for different hold periods (3-year, 5-year, 7-year exits) and different exit cap rate assumptions. Show investors multiple scenarios in board presentations.
Q: What about K-1 distribution? A: Upload K-1s to the portal for secure investor access. Some clients integrate with their tax prep firm’s system to auto-deliver K-1s to the portal when ready.
Stop Losing Investor Confidence to Manual Reporting
Every quarter without investor relations automation means:
Days wasted rebuilding reports from scratch
Investors questioning your professionalism compared to institutional managers
Errors in distribution calculations or performance metrics
Constant email/call interruptions asking basic questions
No forward visibility into lease rollover risk or distribution timing
Difficulty raising capital because LPs don’t trust your reporting
Institutional investors expect institutional-grade reporting. Meeting that bar manually is unsustainable.
The question isn’t whether you need investor relations automation.
The question is: How much LP confidence and staff time are you losing right now?
Related Topics
Ready to Get Started?
Schedule a personalized demo to see this dashboard in action.
Schedule Demo Contact Sales