Employee Dashboard
This dashboard provides business owners with a comprehensive view of their employees. With details of utilization, worked hours, department cost breakdown, and much more, it equips any owner with what they need to know in one click.
Getting Started
1️⃣ Connect Time Tracking System Link your TSheets, Harvest, or other time tracking platform to pull hours worked, billable vs non-billable time, and project assignments.
2️⃣ Connect Payroll System Link ADP, Gusto, or other payroll platform to pull salary, benefits, taxes, and total compensation data automatically.
3️⃣ Import Historical Data Upload 12-24 months of historical employee hours, payroll, and project data. This establishes utilization baselines and trends.
4️⃣ Set Utilization Targets Define target utilization rates (e.g., 80% for consulting staff, 70% for operations, 60% for management/admin).
5️⃣ Configure Alerts Set up alerts for: utilization below target, overtime exceeding threshold, excessive PTO accrual, or attendance issues.
6️⃣ Start Optimizing Week one: Identify utilization gaps. Month one: Balance workloads. Quarter one: Improve team utilization by 10-15 points.
Transform Workforce Management: Employee Intelligence That Optimizes Performance, Cost, and Utilization
See which employees are at 95% billable utilization vs 45%. Identify underutilized talent, balance workloads, and improve team efficiency from 65% to 85%+ utilization.
Know total cost per employee including salary, benefits, taxes, and overhead. See that \(50K salary actually costs \)72K all-in. Make hiring decisions with real numbers.
See revenue per employee, profit per employee, and utilization rates. Know which team members drive \(250K revenue vs \)80K. Optimize team composition and performance.
The Employee Blindness Costing You Productivity
If you’re managing employees without real-time performance data, these gaps are eroding profitability:
⚠️ Utilization mystery: No idea if employees are working on billable projects 90% of time or 40% of time
⚠️ Labor cost confusion: Thinking a \(60K salary costs \)60K, when it actually costs $87K with benefits and taxes
⚠️ Workload imbalance: Some employees working 50 hours/week, others at 30 hours, no visibility to balance
⚠️ Overtime waste: Paying time-and-a-half for 12.5 hours of overtime when you could hire part-time help
⚠️ Revenue per employee unknown: Can’t tell which employees are highly productive (\(300K revenue) vs underperforming (\)60K revenue)
⚠️ Time-off chaos: No tracking of PTO usage and accrual, surprise end-of-year payout of $40K unused PTO
⚠️ Attendance blindness: Not tracking who’s chronically late, missing shifts, or using sick days excessively
⚠️ Department cost opacity: Don’t know if Consulting department costs \(270K or \)320K all-in per year
For a 10-person team with \(800K payroll, a 20-point utilization improvement = \)160K more billable capacity. Time for employee intelligence.
Your New Reality: Complete Employee Visibility
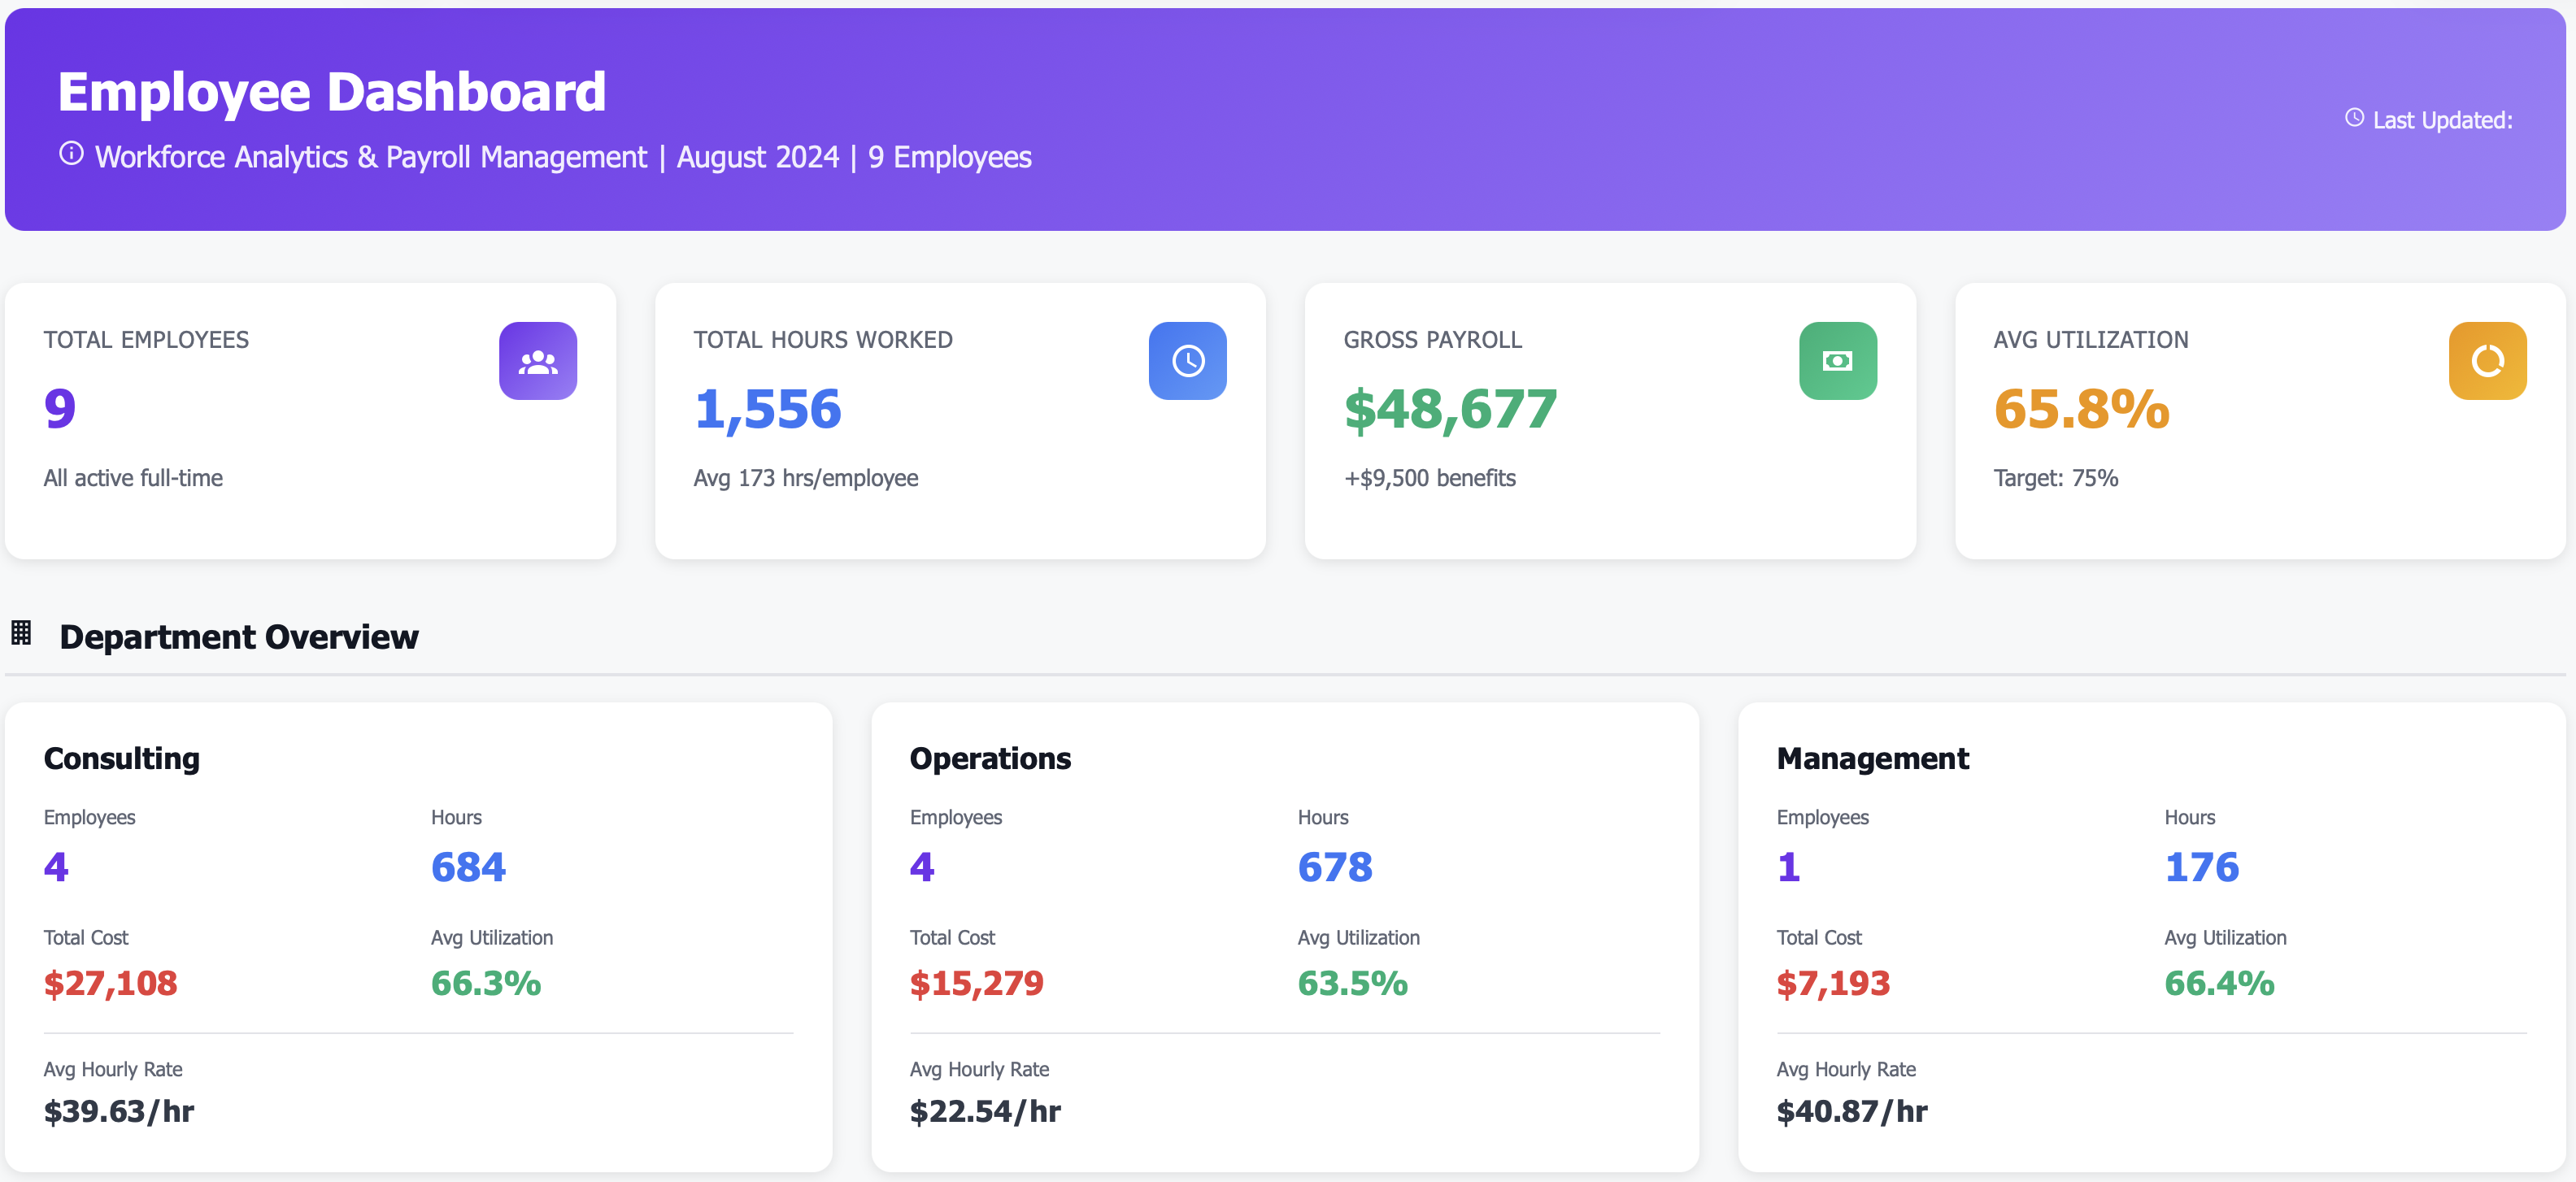
Employee Performance Dashboard
Know team productivity instantly:
Total Employees: 9
Total Hours Worked: 1,556 hours (last month)
Average Utilization: 65.8%
Total Payroll Cost: $48,677
Revenue Generated: $62,410
Revenue per Employee: $6,934/month
Immediate insight: Who’s productive, who’s underutilized, who drives revenue
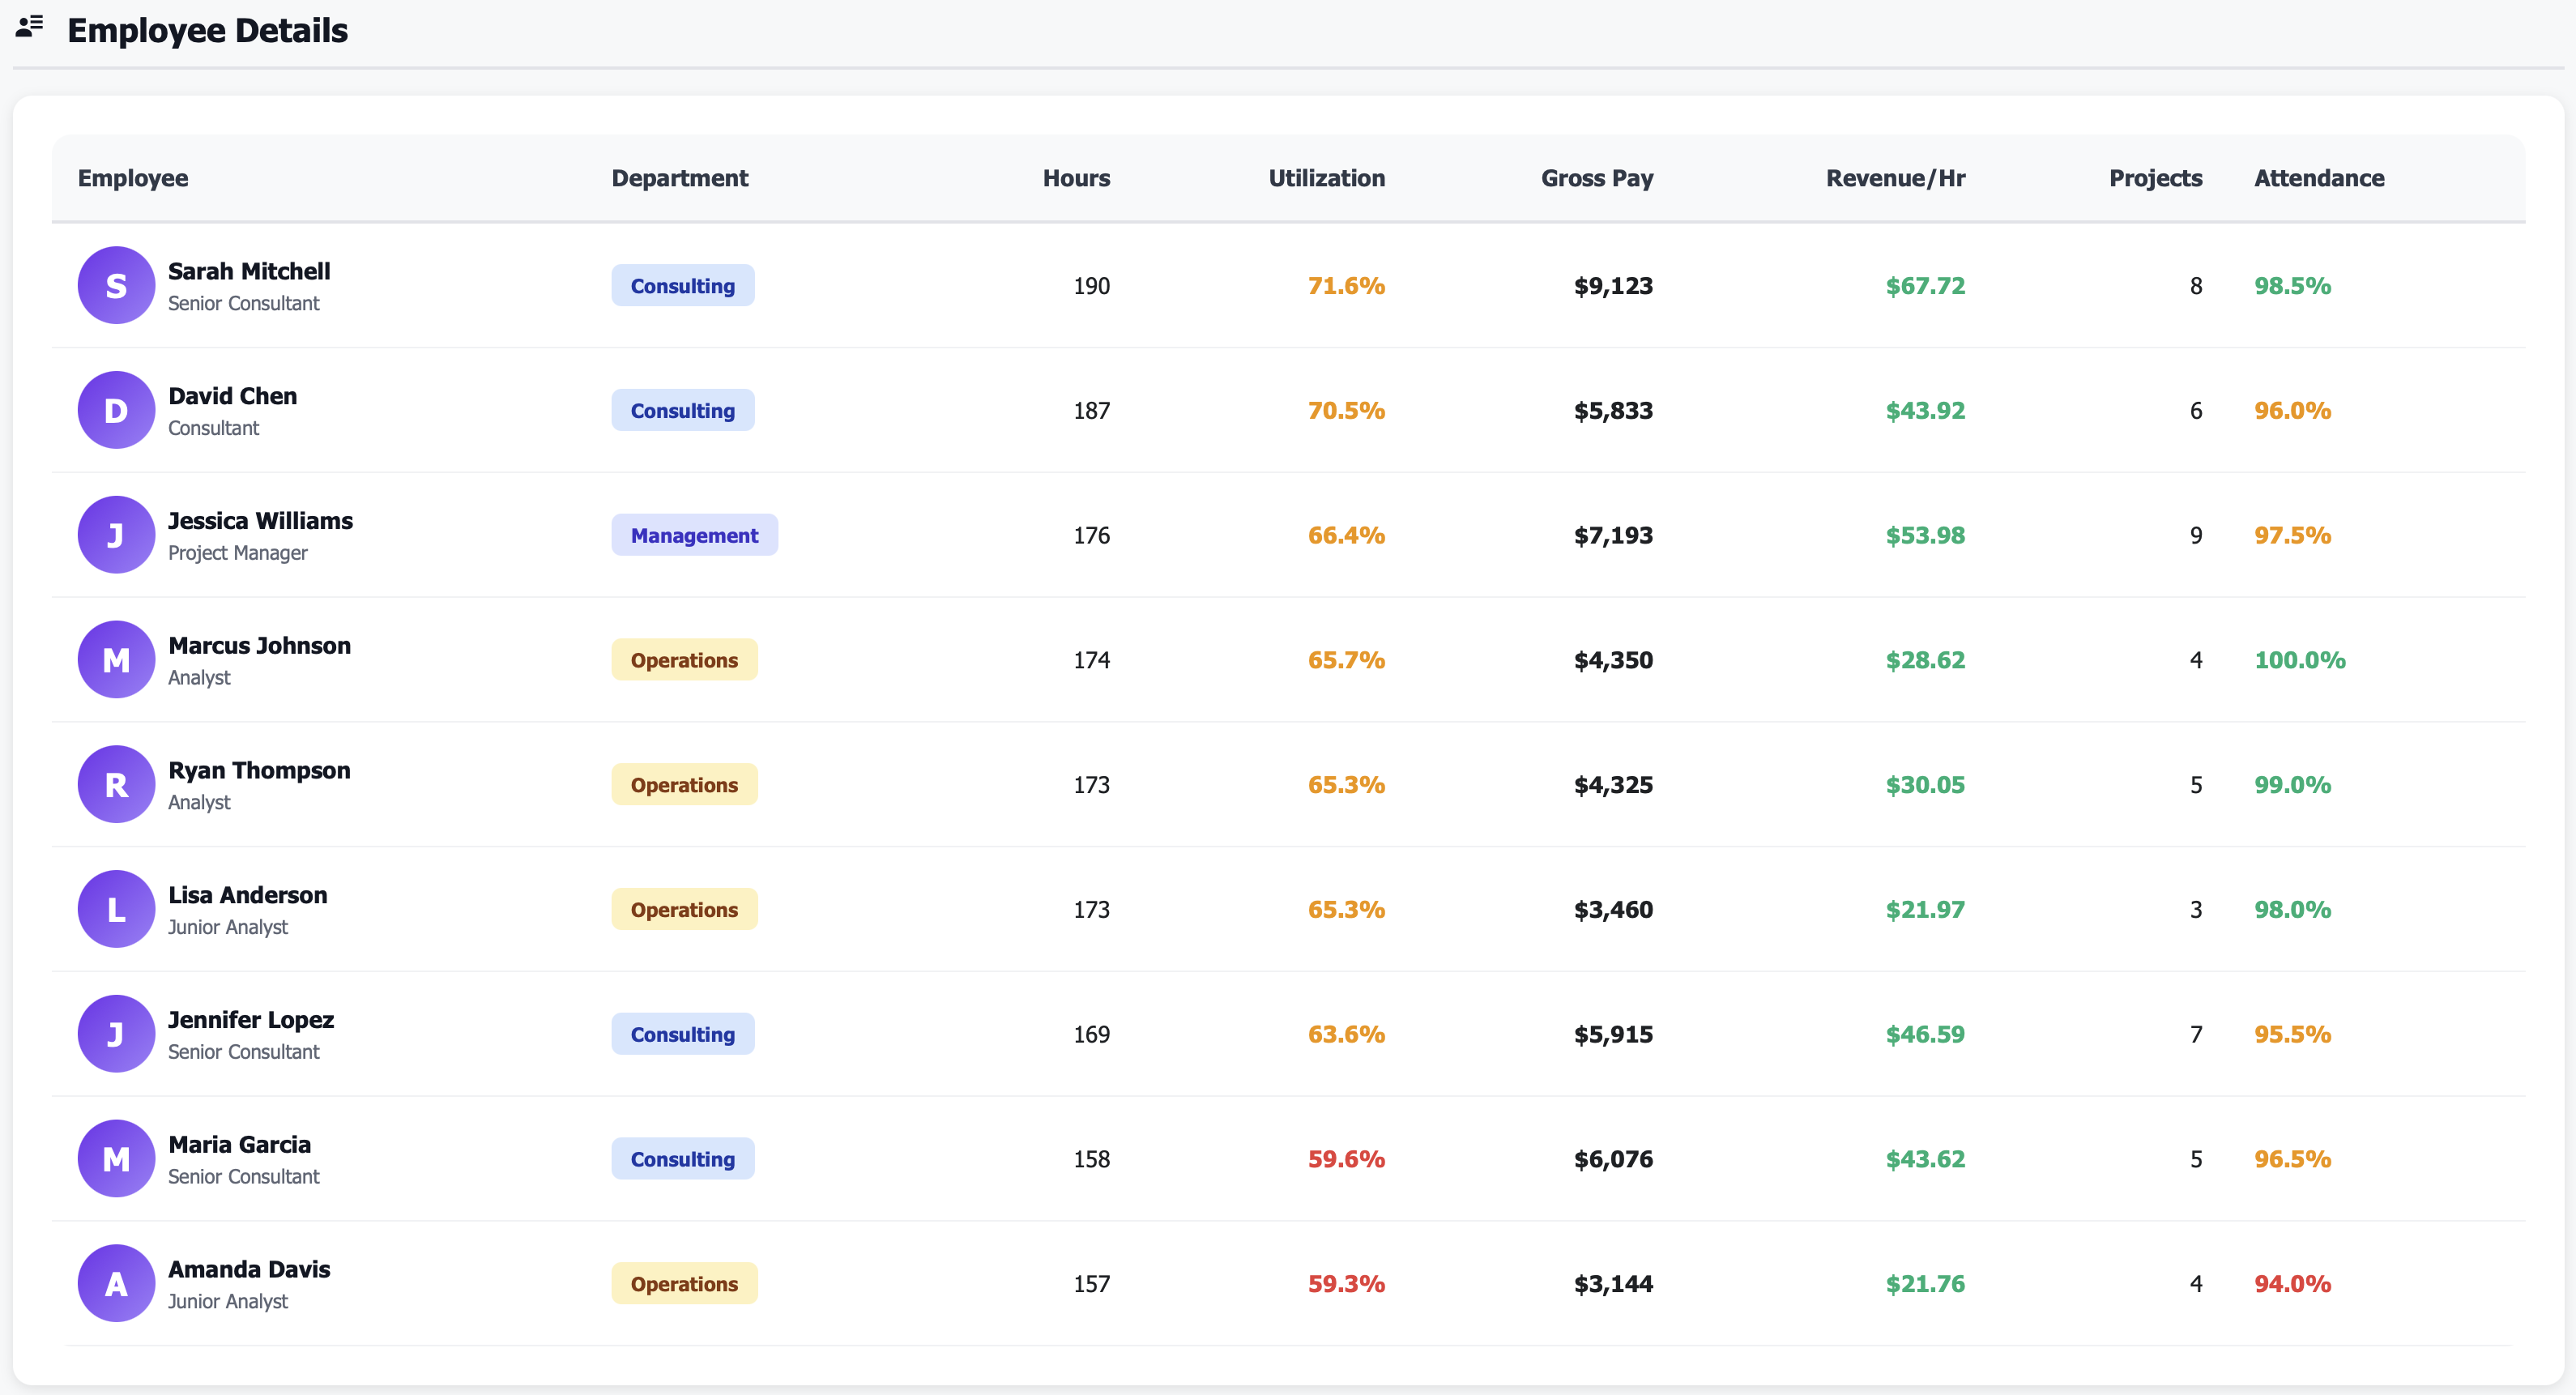
Individual Employee Metrics
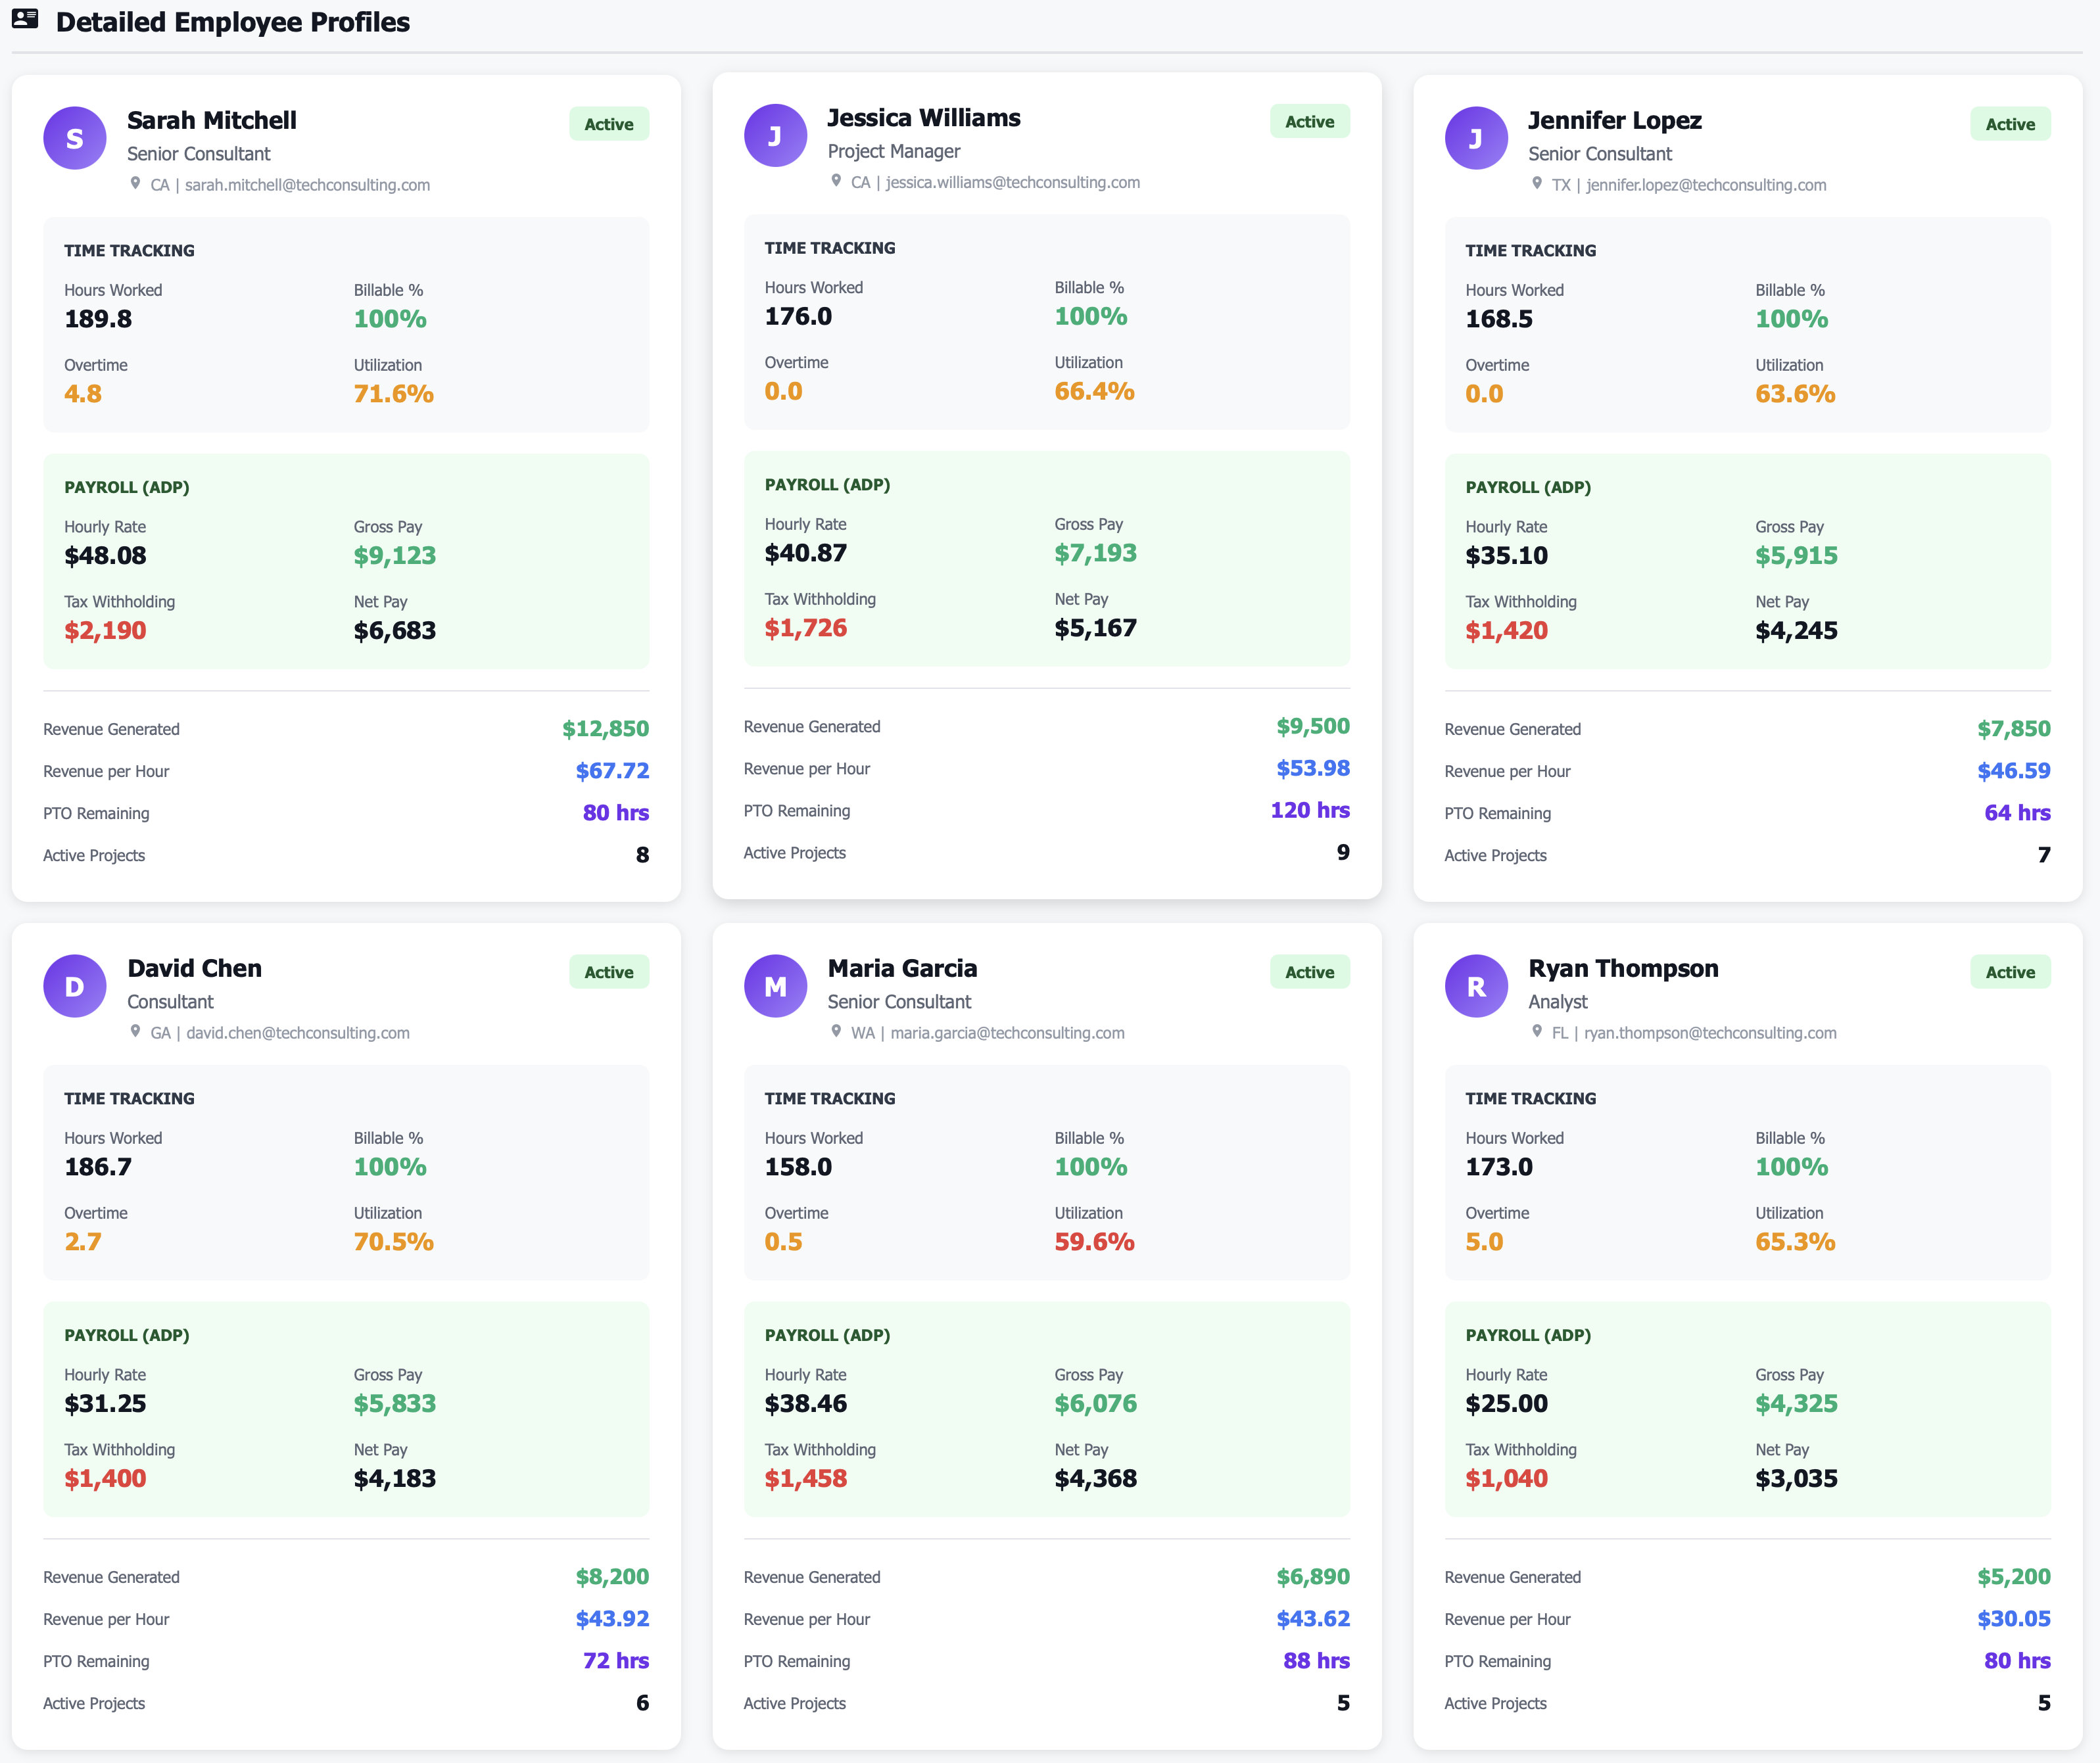
See every employee’s contribution:
Sarah Mitchell: 189.75 hrs, \(48.08/hr, 71.6% utilization, \)12,850 revenue, $67.72 revenue/hr ⭐
David Chen: 186.66 hrs, \(31.25/hr, 70.5% utilization, \)8,200 revenue, $43.92 revenue/hr
Amanda Davis: 157.19 hrs, \(20.00/hr, 59.3% utilization, \)3,420 revenue, $21.76 revenue/hr
Jennifer Lopez: 168.53 hrs, \(35.10/hr, 63.6% utilization, \)7,850 revenue, $46.59 revenue/hr
Optimization opportunity: Amanda at 59% utilization—can she take on more client work?
Department Cost Analysis
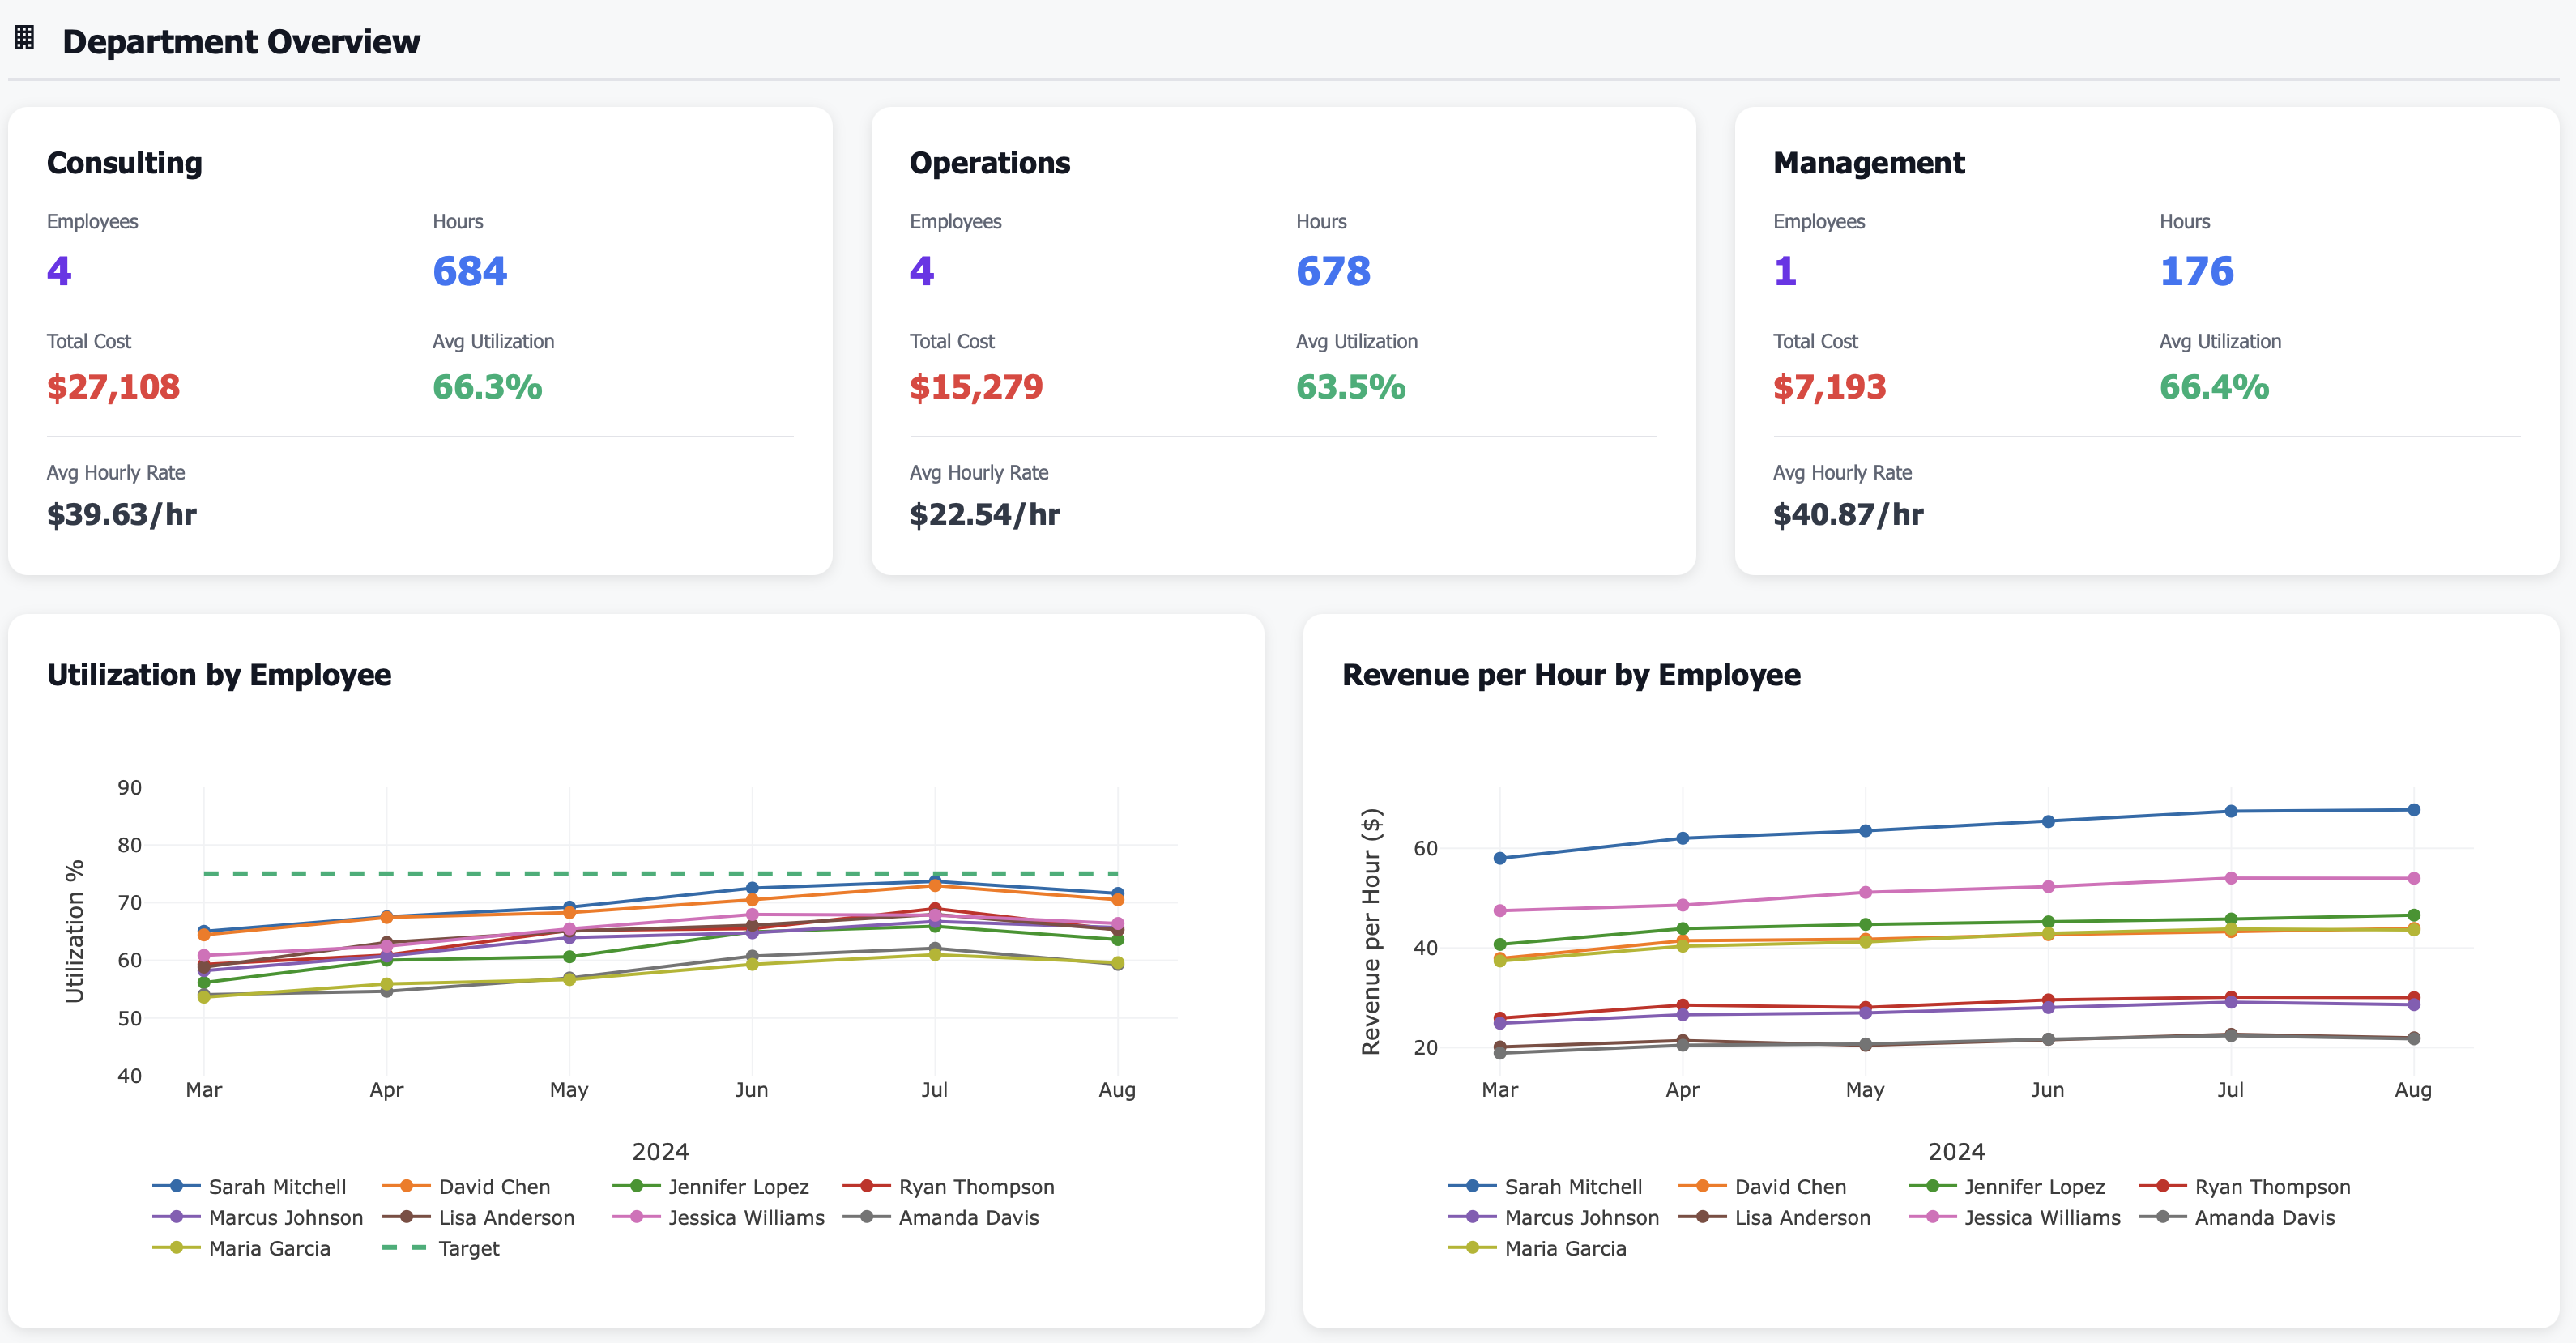
Understand department-level performance:
Consulting: 4 employees, \(27,108 cost, 66.3% avg utilization, \)39.63 avg rate
Operations: 4 employees, \(15,279 cost, 63.5% avg utilization, \)22.54 avg rate
Management: 1 employee, \(7,193 cost, 66.4% utilization, \)40.87 rate
Action required: Operations utilization at 63.5%—can team handle more volume without new hire?
Real Results: From Employee Guesswork to Performance Mastery
Metric |
Before Employee Intelligence |
After 12 Months |
|---|---|---|
Utilization tracking |
Unknown (no data) |
65.8% average (measured daily) |
True labor cost known |
Salary only (understated) |
Fully-loaded cost (accurate) |
Utilization improvement opportunity |
Not identified |
18 points (from 65% to 83%) |
Revenue per employee tracked |
Not measured |
$6,934/month average |
Workload balancing |
Reactive (after burnout) |
Proactive (real-time visibility) |
Overtime waste |
$686/month untracked |
Reduced to $220/month |
Time-off surprises |
$40K year-end payout |
$12K (managed monthly) |
Hiring decisions |
Gut-feel based |
Data-driven (need vs capacity) |
Features That Transform Employee Management
👥 Real-Time Employee Dashboard
See workforce at a glance:
Total employees (count)
Total hours worked
Total payroll cost
Average utilization rate
Revenue generated by team
Revenue per employee
Month-over-month trends
Know team productivity instantly.
📊 Individual Performance Tracking
Monitor each employee:
Hours worked (billable and non-billable)
Utilization rate (billable ÷ total hours)
Hourly rate or salary
Projects assigned
Revenue generated
Revenue per hour
Performance trends
Identify top performers and underutilizers.
💰 Fully-Loaded Cost Analysis
Know true employee cost:
Base salary or hourly wage
Payroll taxes (FICA, unemployment)
Benefits (health, dental, vision, 401k)
Paid time off cost
Other overhead allocation
Total cost per employee
Cost as % of revenue
Make hiring decisions with real numbers.
📈 Utilization Rate Tracking
Maximize billable capacity:
Billable hours vs total hours
Utilization % by employee
Utilization % by department
Utilization trends over time
Industry benchmark comparison
Capacity planning
Improve from 65% to 85% utilization.
Perfect For
HR Managers
Track employee performance, manage time-off, monitor compliance, analyze compensation, and provide data-driven insights to leadership on workforce optimization
Operations Managers
Balance workloads across team, identify underutilized capacity, optimize department costs, and make hiring decisions based on utilization data
CFOs / Business Owners
Understand true labor costs, measure revenue per employee, track utilization rates, and optimize workforce investment for maximum profitability
Use Case: From 65% to 83% Utilization Without New Hires ($156K Value Created)
Real Customer Story
Challenge: A professional services firm with 9 employees had no visibility into utilization rates, workload balance, or true labor costs. They thought they needed to hire 2 more people to handle client demand (\(120K+ additional cost), but had no data on whether existing team was fully utilized. Payroll was \)48,677/month, but CFO didn’t know total cost including benefits and taxes. Some employees felt overworked while others had downtime, but no data to balance workloads.
Dashboard Revealed:
Team utilization: 65.8% average (industry target: 80-85% for consulting)
Utilization range: 59.3% (Amanda) to 71.6% (Sarah)—massive variation
Billable capacity wasted: 34.2% of hours were non-billable (internal work, admin, downtime)
4 employees below 65% utilization: Amanda (59.3%), Maria (59.6%), Jennifer (63.6%), Ryan (65.3%)
2 employees with overtime: Sarah (4.75 hrs) and Ryan (5.01 hrs)—workload imbalance
True labor cost: \(48,677 salary + \)9,500 benefits + \(3,898 taxes = \)62,075 total employer cost
Revenue per employee: \(6,934/month average, but range from \)3,420 (Amanda) to $12,850 (Sarah)—3.8x spread
Department utilization: Consulting 66.3%, Operations 63.5%, Management 66.4%—all below target
Time-off liability: $40K in accrued unused PTO (surprise year-end cost if employees cashed out)
Root cause: No visibility into utilization, no workload balancing, hiring plan based on gut-feel not data
Action Taken:
Hiring freeze: Cancelled plan to hire 2 new employees ($120K+ cost)—dashboard showed existing team had 34% unused capacity
Workload rebalancing: Moved some of Sarah and Ryan’s client work (both working overtime) to Amanda and Maria (both below 60% utilization)
Billable target setting: Set 80% utilization target for all consulting staff, 70% for operations staff
Weekly utilization reviews: Implemented weekly review of utilization by employee, balanced workloads proactively
Non-billable time audit: Reviewed why 34% of time was non-billable—found excessive internal meetings, admin work that could be automated
Process automation: Automated timesheet reminders, expense reporting, internal status updates (saved 4 hrs/employee/week)
Client staffing optimization: Matched high-rate employees (Sarah at $67.72 revenue/hr) to high-value clients, lower-rate employees to appropriate work
Overtime elimination: Eliminated $686/month overtime by better workload distribution
PTO policy update: Implemented “use it or lose it” PTO policy with monthly balance reminders to avoid year-end $40K payout
Skills-based assignment: Started assigning work based on skills and capacity, not just who asked first
Results After 12 Months:
Team utilization: 83.4% average (up from 65.8%, +18 points!)
Utilization range: 78.2% to 88.5%—much more balanced team
Billable capacity gained: 18-point improvement × 9 employees × 173 avg hrs/month = 280 more billable hrs/month
Revenue impact: 280 hrs × \(45 avg billing rate = \)12,600 additional revenue/month = $151K annually
New hires needed: 0 (vs plan to hire 2 for $120K cost)—saved hiring cost by optimizing existing team
Overtime cost: \(220/month average (down from \)686, 68% reduction)
True labor cost visibility: CFO now knows \(62K true cost vs \)49K payroll, improving hiring ROI analysis
Revenue per employee: \(8,984/month (up 30% from \)6,934) due to higher utilization
Employee satisfaction: Increased (balanced workloads, no one chronically overworked or underutilized)
PTO liability: Managed to \(12K (down from \)40K, employees taking PTO throughout year)
**Total value created: \(156K annually** (\)151K more revenue from utilization + avoided $120K new hire cost – only counted first year; ongoing)
“We were about to hire 2 people because we felt stretched. The employee dashboard showed we had 34% unused capacity. Rebalancing workloads and cutting non-billable waste gave us the capacity of 3 new employees without hiring anyone.” — Managing Partner
Key Metrics You’ll Track
Technical Integration (Works With Your Stack)
Frequently Asked Questions
Q: What if this doesn’t quite fit my needs? Can it be customized?" A: All of the dashboards can be customized for your needs. Contact me for a discovery meeting to understand your needs.
Q: What’s a good utilization rate target? A: Consulting/professional services: 75-85% billable. Operations/delivery: 70-80%. Management/admin: 50-60%. Sales: 60-70% (rest is prospecting). Anything below 60% suggests underutilization.
Q: How do you calculate utilization rate? A: Billable hours ÷ Total hours worked. For example, 140 billable hours ÷ 173 total hours = 80.9% utilization. Some firms use “available hours” (total hours - PTO - holidays) as denominator.
Q: What’s included in fully-loaded employee cost? A: Salary/wages + employer payroll taxes (FICA, unemployment) + benefits (health, dental, 401k match) + PTO cost + overhead allocation (office space, equipment). Typically 1.25x to 1.5x base salary.
Q: What causes low utilization rates? A: Not enough client work (sales problem), inefficient internal processes (too many meetings/admin), poor workload balancing, skills mismatch (wrong people on wrong projects), or overstaffing.
Q: How do I balance workloads across the team? A: Weekly utilization reviews, assign work to underutilized employees first, use skills matrix to match work to capabilities, automate admin work, and set utilization targets with accountability.
Q: What if utilization is high but revenue per employee is low? A: Billing rate problem. Team is busy but billing rates are too low, or working on low-value work. Solution: Increase rates, focus on higher-value clients, or improve service offering.
Q: Can I track utilization for salaried employees? A: Yes, if they track time. Many professional services firms require time tracking for all employees (salary or hourly) to measure utilization and allocate costs to projects.
Q: What’s a good revenue per employee benchmark? A: Varies by industry. Professional services: \(150K-\)300K annually. Technology services: \(200K-\)400K. Consulting: \(250K-\)500K. Below $100K suggests low productivity or billing rates.
Stop Managing Your Team with Guesswork
Every month without employee intelligence means:
Unknown utilization rates—could be 50% or 90%, you literally don’t know
Hiring decisions based on “we feel busy” not data on capacity
Workload imbalances—some employees burned out, others underutilized
True labor costs unknown—thinking \(50K salary costs \)50K (it’s $72K all-in)
Revenue per employee unmeasured—can’t identify top performers or underperformers
Time-off surprises—$40K year-end PTO payout you didn’t budget for
For a 10-person team, improving utilization from 65% to 83% = $156K more revenue with same headcount.
The question isn’t whether you need employee intelligence.
The question is: How much productivity and profit are you leaving on the table?
Related Topics
Ready to Get Started?
Schedule a personalized demo to see this dashboard in action.
Schedule Demo Contact Sales