Dynamic Rent Optimization Dashboard
Get unit-level rent recommendations vs. market, model rent increase scenarios (conservative, moderate, aggressive) to see revenue-occupancy tradeoffs, and optimize pricing for renewals and vacant units. Most portfolios capture 200-500 bps of additional rent growth, adding $500K-$2M+ annually through data-driven pricing strategy.

Getting Started
1️⃣ Connect Your Property Management System Link your PM system to pull current rents, lease expiration dates, unit mix, and occupancy data. This establishes your baseline.
2️⃣ Import Market Data Connect market data sources (CoStar, RealPage) or upload competitive rent surveys. This shows your market positioning.
3️⃣ Set Your Targets Define your goals: revenue maximization (accept lower occupancy) or stability (maintain high occupancy). Set occupancy floor (92%? 90%?).
4️�4 Configure Pricing Rules Set maximum increases (8%? 10%?), long-term resident protections, affordable housing compliance rules, and approval workflows.
5️⃣ Review Recommendations Day one: See unit-level rent recommendations. Week one: Model scenarios (conservative, moderate, aggressive). Month one: Implement optimized pricing.
6️⃣ Track Results Monitor rent growth, occupancy, revenue per unit, and renewal rates. Adjust strategy quarterly based on results and market changes.
Stop Leaving Money on the Table: Rent Optimization That Maximizes Revenue
Identify underpriced units leaving \(50-\)200/month on the table. See which units can handle 8% increases and which are maxed out at 3%—optimize every unit.
Model rent increase scenarios: Conservative (3%, 97% occ), Moderate (5%, 94% occ), Aggressive (8%, 89% occ). Know the revenue-occupancy tradeoff before you commit.
See which units are rolling in next 60-90 days. Know market rent vs. current rent for each unit. Push rates when demand is high, hold when supply is coming.
The Rent Optimization Problem Costing You Revenue
If you’re managing rent pricing across properties, these blindspots are leaving millions on the table:
⚠️ Unit-level pricing guesswork: Setting rents based on “feels about right” instead of unit-specific market data
⚠️ Blanket increases: Giving all units the same 5% increase when some could take 10% and others should get 2%
⚠️ No market context: Not knowing if your 2BR/2BA at \(1,850 is \)150 below market or $50 above market
⚠️ Lease renewal timing blindness: Units renewing in 30 days but you haven’t analyzed optimal increase yet—scrambling at the last minute
⚠️ Occupancy-revenue tradeoff mystery: Should you push for 96% occupancy at lower rents or 91% occupancy at higher rents? Which makes more money?
⚠️ Vacant unit pricing paralysis: Unit sitting vacant at \(2,100—should you drop to \)2,000 or hold firm? No data to guide the decision
⚠️ No sensitivity analysis: Don’t know if 6% increase drives 2% occupancy loss or 8% occupancy loss—flying blind
⚠️ Competition oblivious: Your competitor dropped rents \(75/month two weeks ago—you're still priced \)100 higher and wondering why traffic is down
Poor rent optimization = 200-500 bps of lost revenue = \(2M-5M annually on a \)100M portfolio. Time to get strategic.
Your New Reality: Data-Driven Rent Optimization
Unit-Level Rent Recommendations
Optimize every unit individually:
Unit 204 (2BR): Current \(1,750, Recommended \)1,925 (+$175, 10% increase - well below market)
Unit 318 (1BR): Current \(1,450, Recommended \)1,495 (+$45, 3% increase - at market ceiling)
Unit 521 (2BR): Current \(1,925, Recommended \)1,925 (no change - properly priced)
Unit 407 (3BR): Current \(2,200, Recommended \)2,050 (-$150 - overpriced, vacant 45 days)
Precision pricing, not blanket increases
Revenue Scenario Modeling
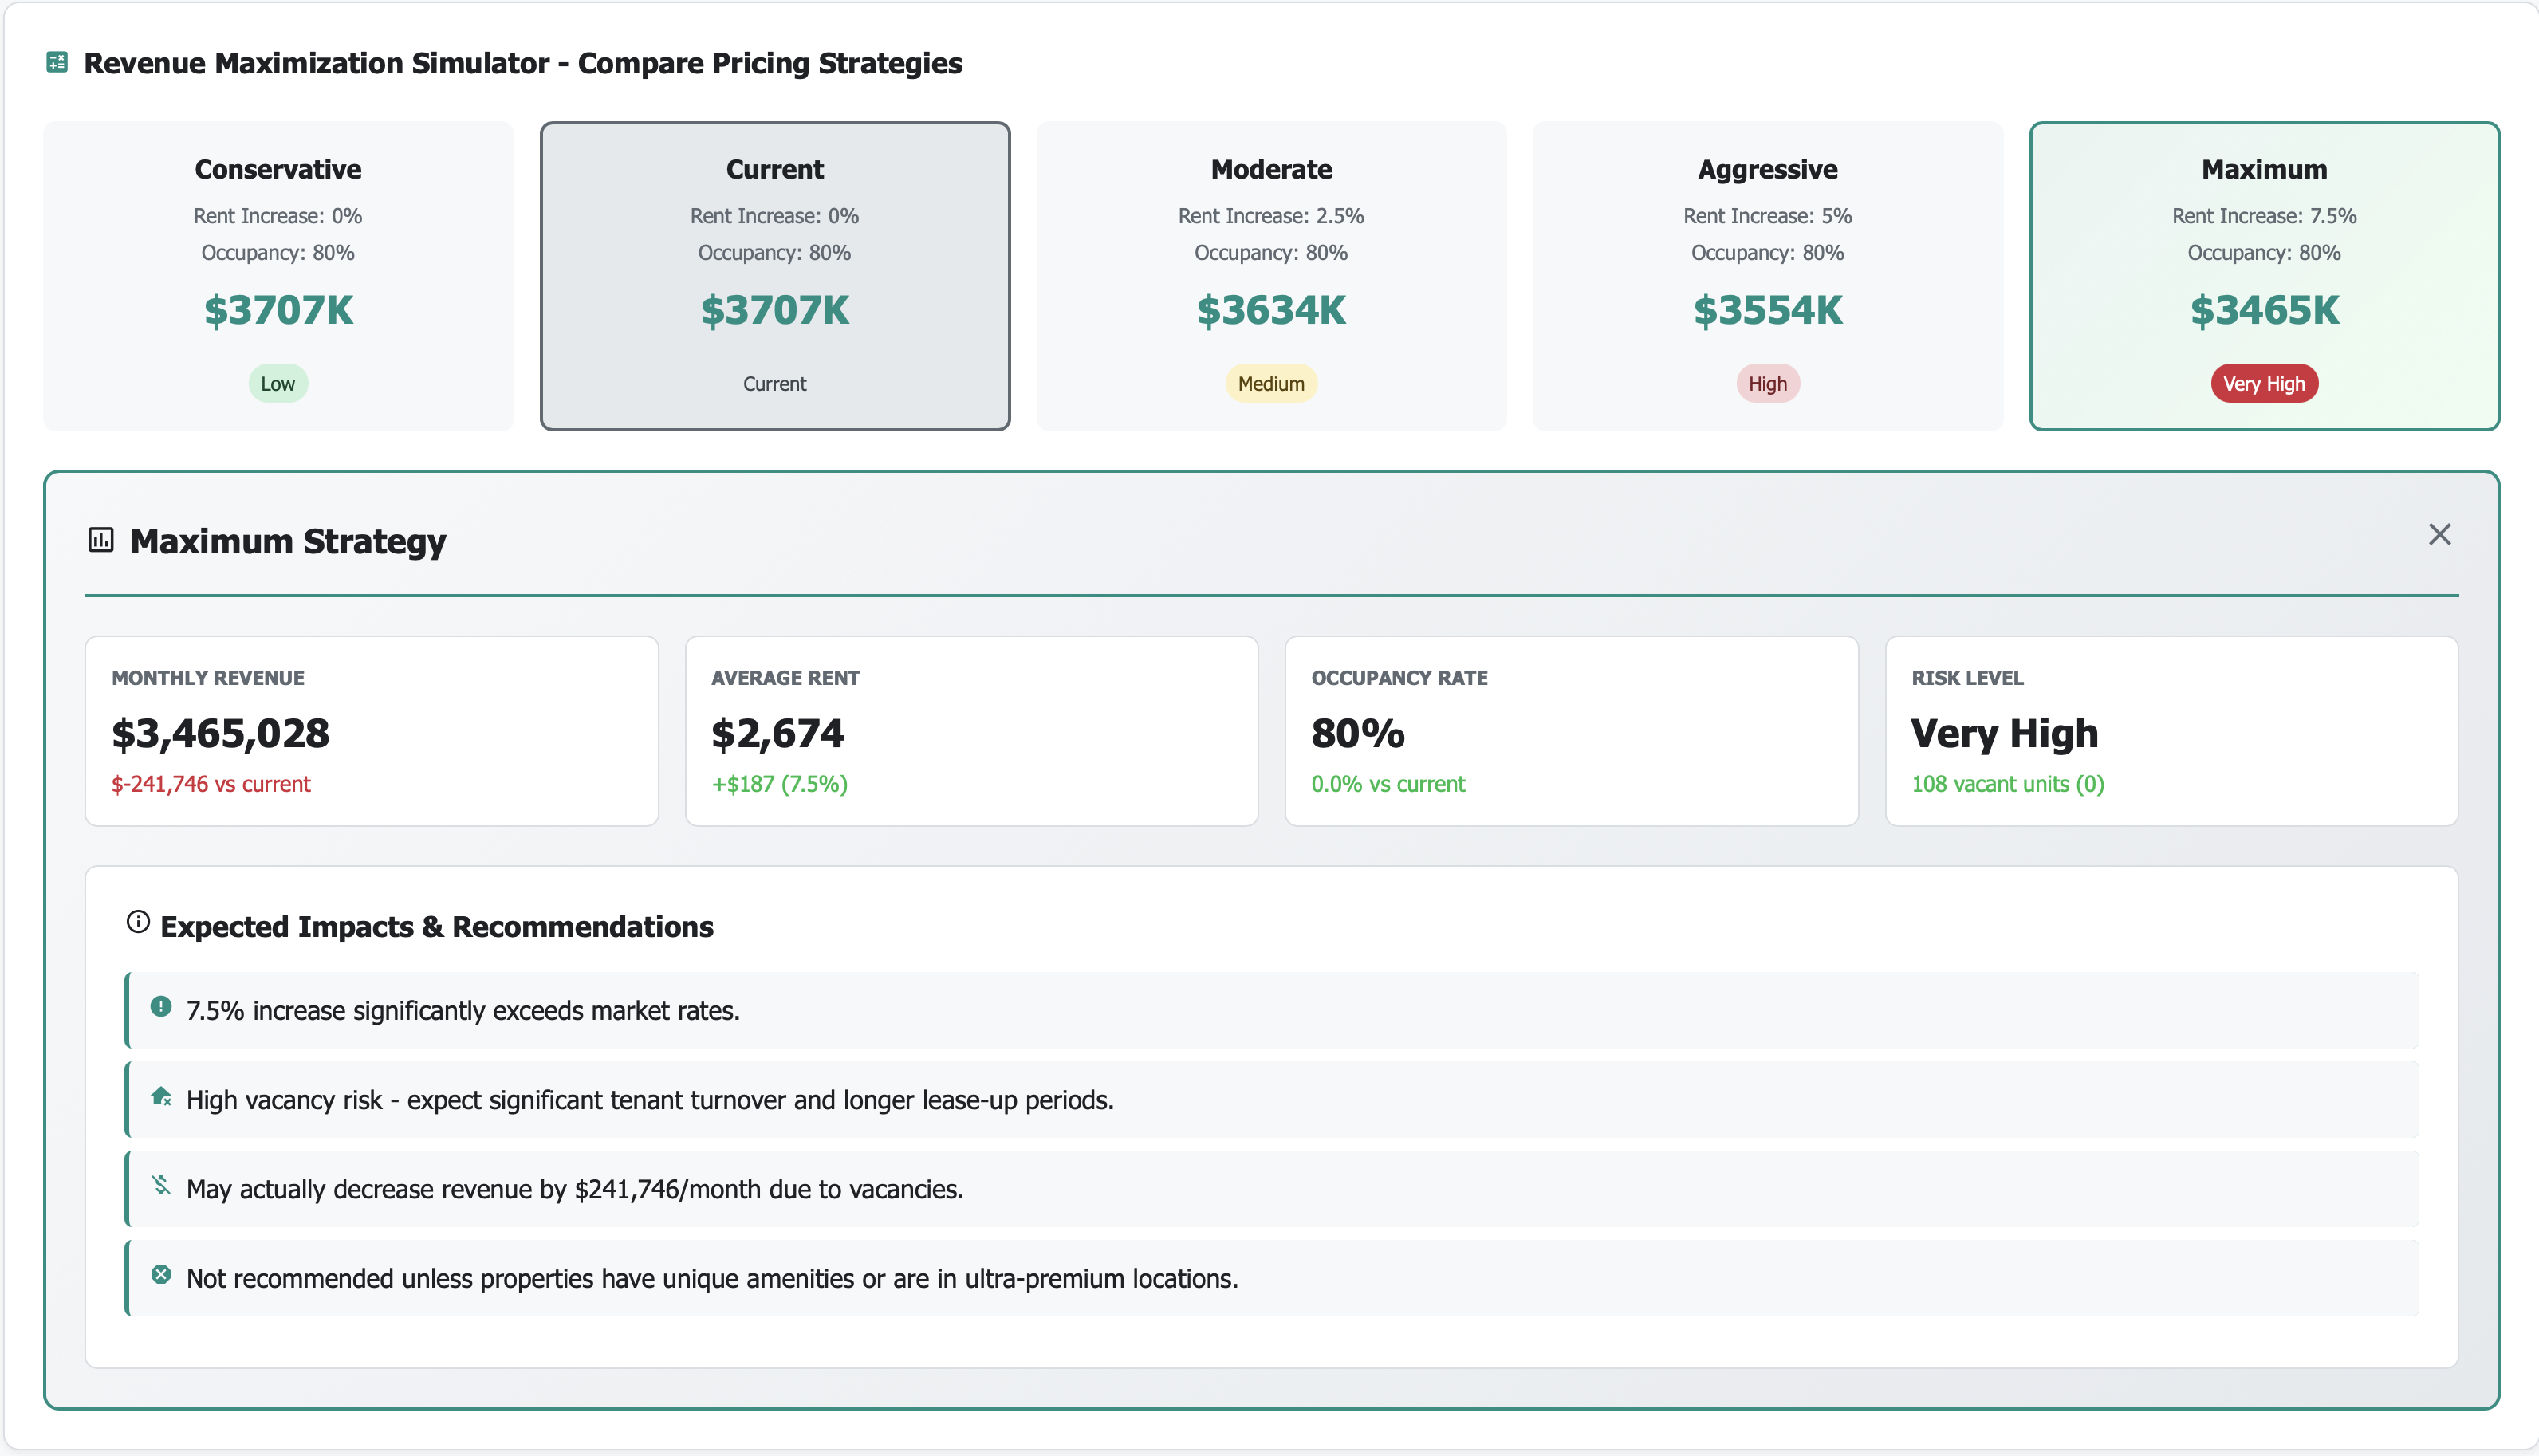
See the revenue-occupancy tradeoff:
Conservative (3% increase): $4.82M revenue, 96.5% occupancy (safe but leaving money)
Moderate (5% increase): $4.98M revenue, 94.2% occupancy (optimal balance - RECOMMENDED)
Aggressive (8% increase): $5.08M revenue, 89.8% occupancy (max revenue but risky)
Current (0% increase): \(4.65M revenue, 97.1% occupancy (opportunity cost: \)330K annually)
Model before committing, know the stakes
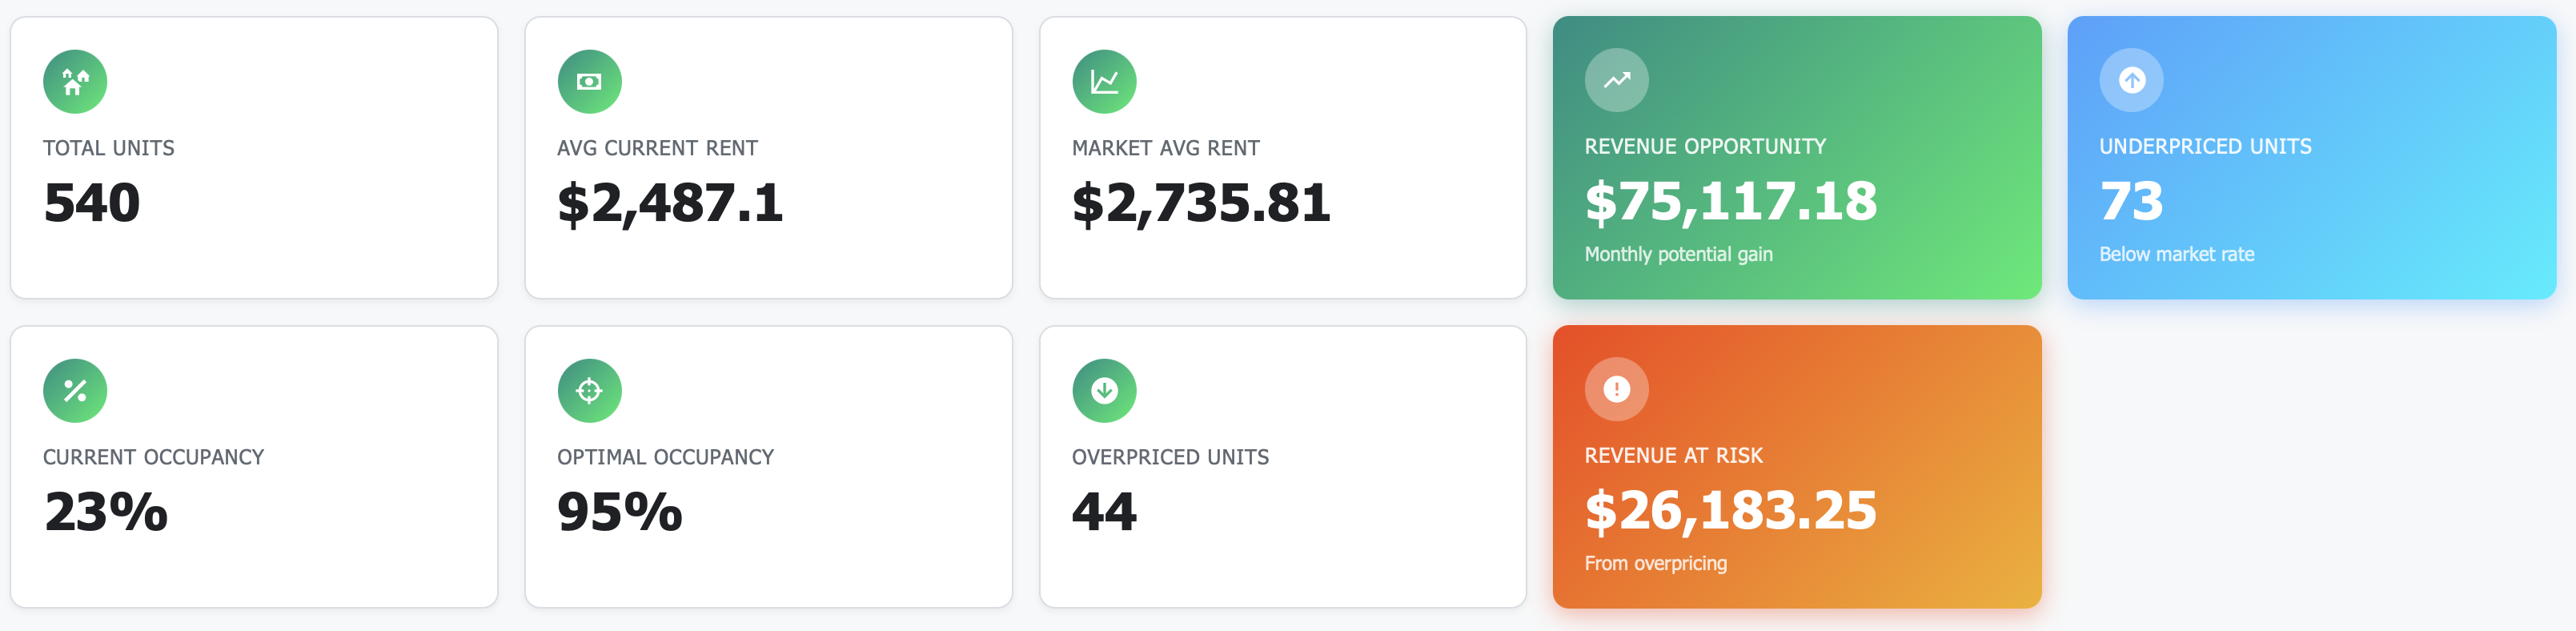
Market Rent vs. Current Rent Gap Analysis
See where you’re leaving money:
Studios: Market \(1,325, Your Avg \)1,285 (-$40, 3% below)
1BR: Market \(1,525, Your Avg \)1,475 (-$50, 3.3% below)
2BR: Market \(1,950, Your Avg \)1,825 (-$125, 6.4% below - BIG OPPORTUNITY)
3BR: Market \(2,450, Your Avg \)2,475 (+$25, 1% above - properly priced)
Close the gap on underpriced unit types
Real Results: From Pricing Guesswork to Revenue Mastery
Metric |
Before Rent Optimization |
After 12 Months |
|---|---|---|
Portfolio average rent |
$1,725 (no strategy) |
$1,848 (optimized, +7.1%) |
Revenue per unit (annual) |
$20,700 (stagnant) |
$22,176 (growing, +7.1%) |
Occupancy |
96.8% (too high?) |
94.5% (optimal tradeoff) |
Portfolio revenue (500 units) |
$10.35M annually |
\(11.09M annually (+\)740K!) |
Underpriced units identified |
Unknown |
127 units (25% of portfolio) |
Vacant unit pricing speed |
12 days to adjust (slow) |
2 days to adjust (data-driven) |
Renewal offer consistency |
Chaotic (2-12% range) |
Strategic (3-9% by unit) |
Annual revenue optimization |
— |
$740K captured |
Features That Transform Rent Strategy
💰 Unit-Level Rent Recommendations
For every unit, see:
Current rent
Market rent (from comp analysis)
Recommended rent (optimal for your goals)
Dollar increase and percentage
Confidence level (based on data quality)
Timing recommendation (now, in 30 days, at renewal)
Individualized pricing for every unit.
📊 Revenue Scenario Modeling
Model different rent increase strategies:
Conservative: Low increase (2-3%), maximize occupancy
Moderate: Balanced increase (4-6%), optimal revenue
Aggressive: High increase (7-10%), maximize rent
Custom: Set your own increase, see projected impact
See revenue, occupancy, and risk before you commit.
🎯 Market Rent Benchmarking
Compare your rents to market by:
Unit type (Studio, 1BR, 2BR, 3BR)
Property (cross-property comparison)
Submarket (your area vs. other areas)
Competitive set (your 5-10 direct competitors)
Know where you stand vs. competition.
🔄 Lease Renewal Optimization
For units renewing in next 60-90 days:
Current rent vs. market rent gap
Resident tenure (1 year vs. 5 years - different strategies)
Payment history (on-time payer deserves better offer)
Renewal probability estimate
Recommended increase (personalized)
Maximize renewals while capturing rent growth.
📉 Vacant Unit Pricing Strategy
For every vacant unit:
Days vacant (urgency indicator)
Market rent vs. current asking rent
Competitive units available nearby
Pricing recommendation (hold, drop \(50, drop \)100)
Expected time to lease at each price point
Optimize vacancy loss vs. rent loss tradeoff.
📈 Rent Trend Analysis
Track rent movements over time:
Portfolio average rent (12-24 month trend)
Rent growth by unit type
Rent growth by property
Market rent trends (is market accelerating or cooling?)
Understand momentum, time your moves.
🏠 Underpriced Unit Identification
Automatically flag units that are:
5%+ below market rent
10%+ below market rent (urgent opportunity)
Below your own property average for similar units
Unchanged for 18+ months (probably due for increase)
Find easy wins, capture low-hanging fruit.
💡 New Lease Pricing Guidance
For upcoming vacant units:
Recommended starting asking rent
Floor rent (lowest you should go)
Ceiling rent (aspirational if market is hot)
Comparable unit rents (what did similar units lease for?)
Start strong, negotiate from strength.
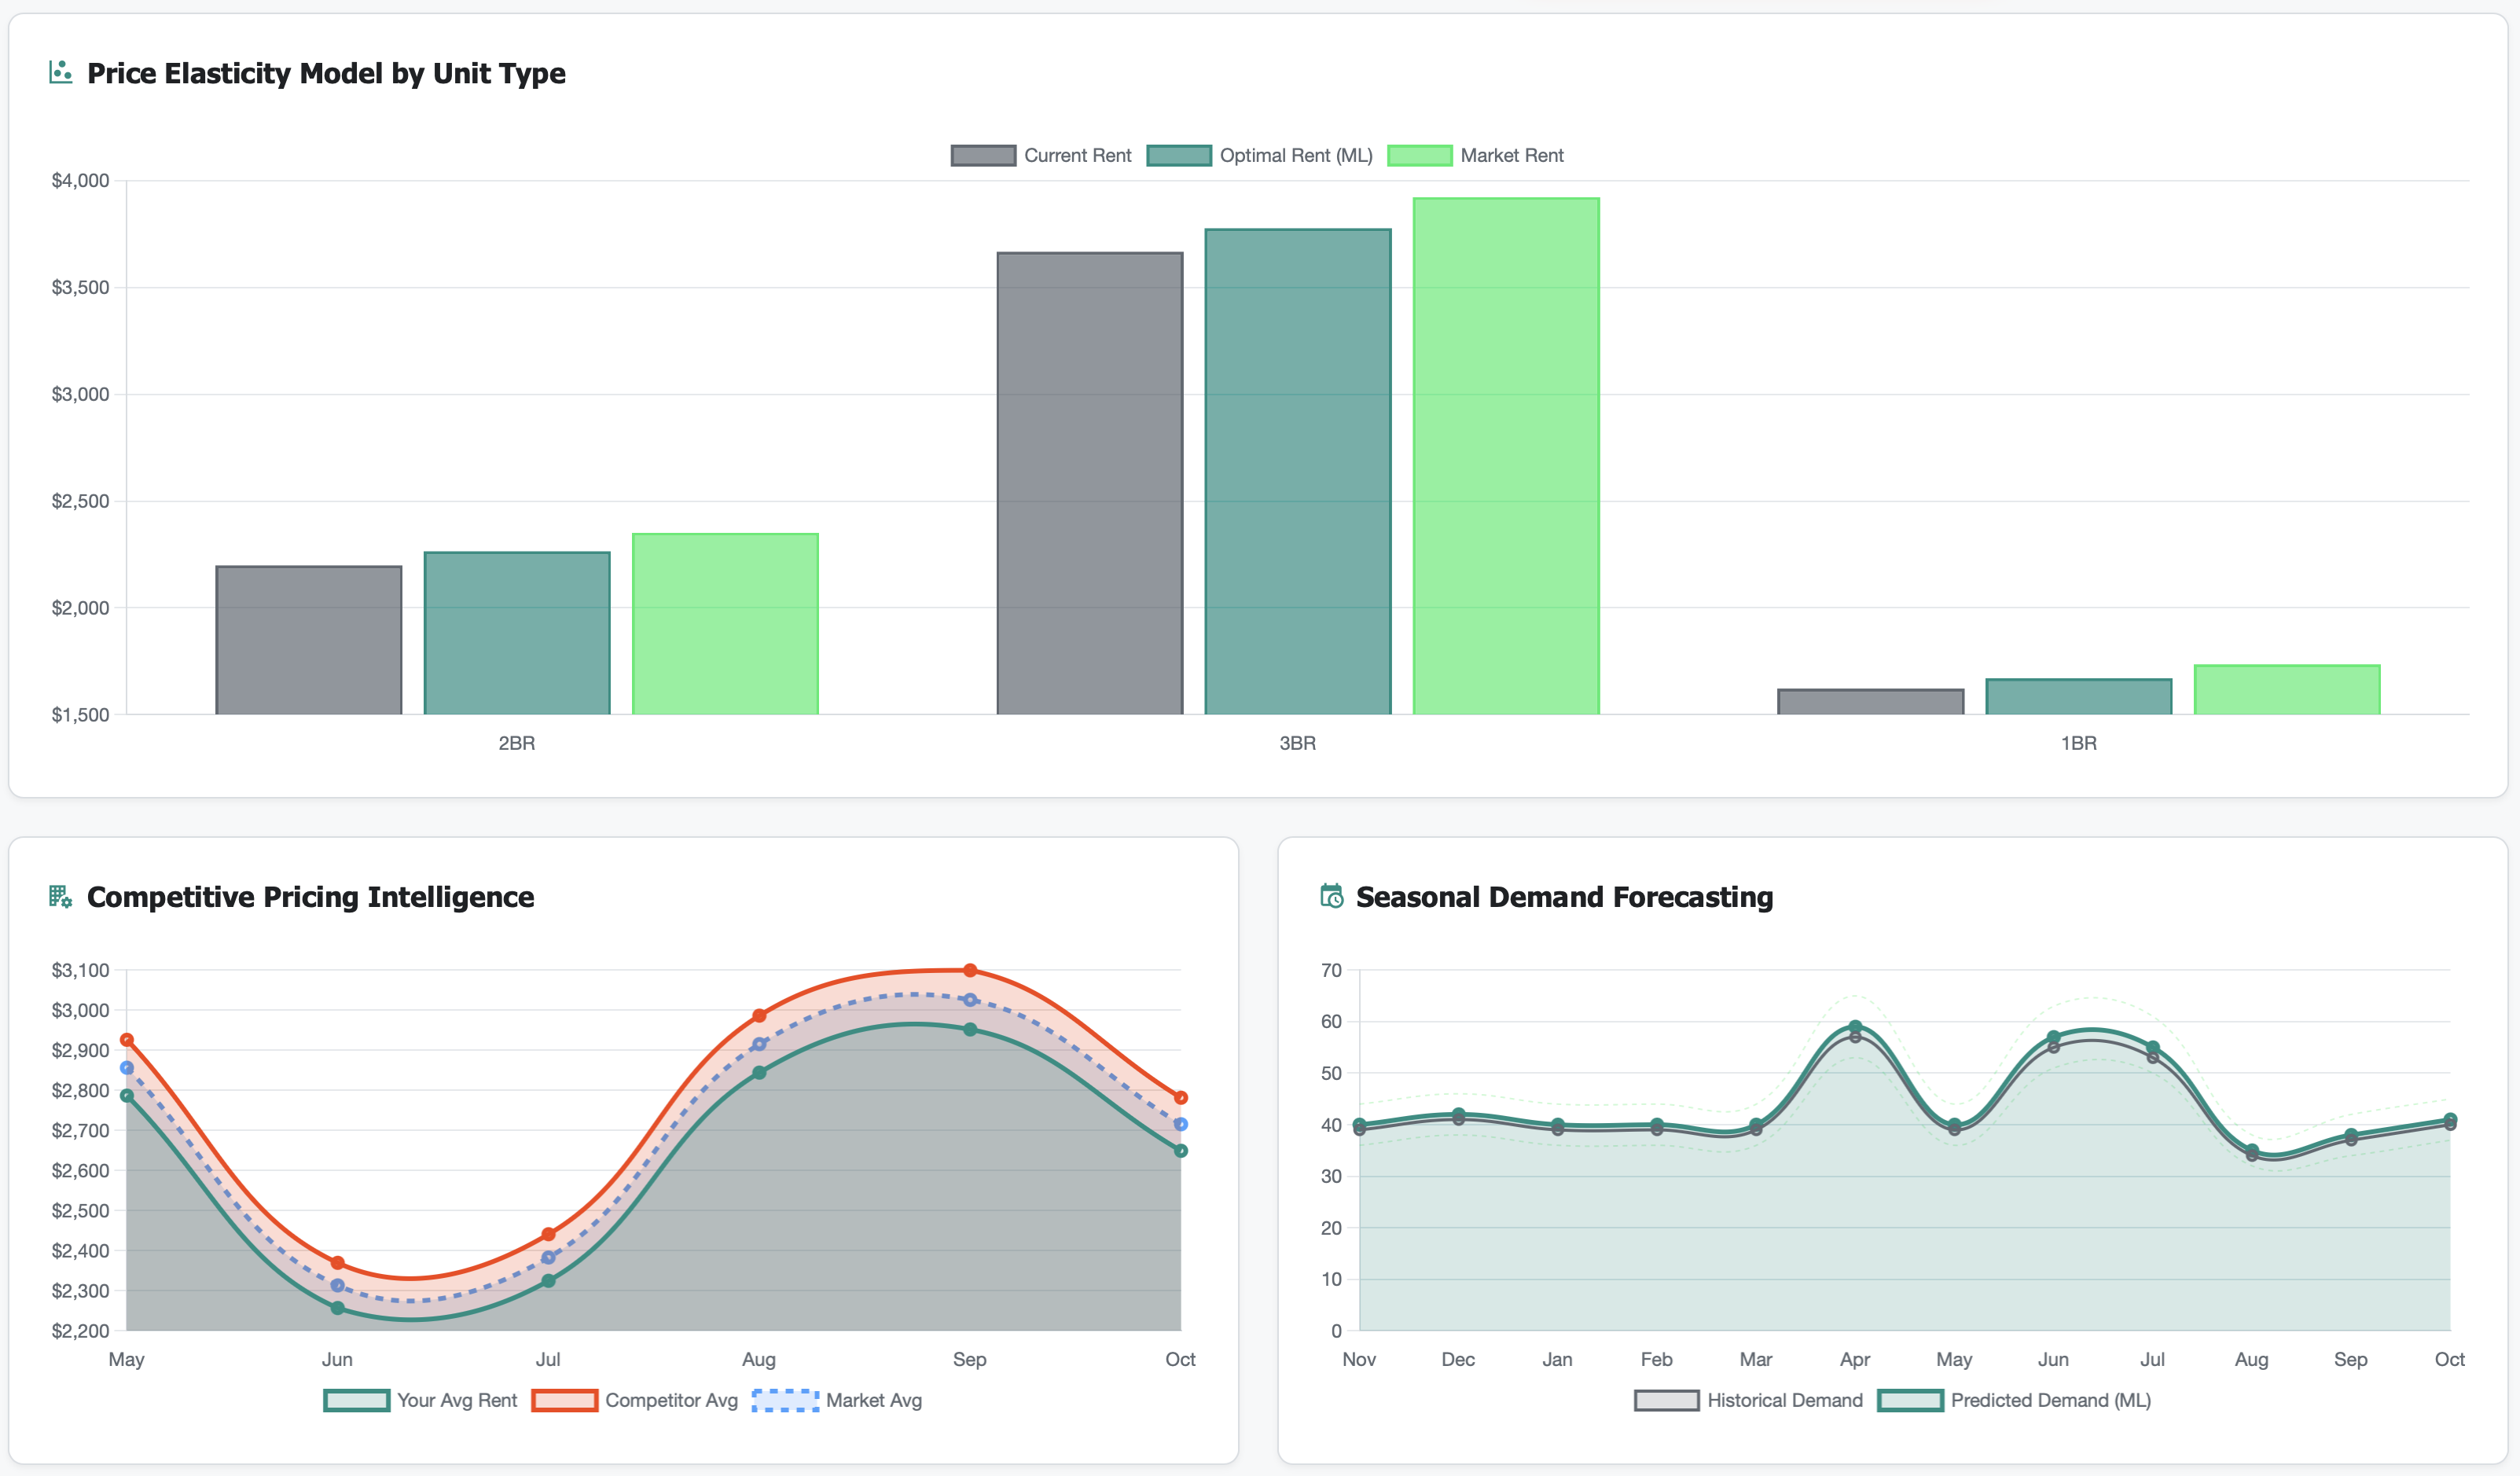
🔮 Seasonality Adjustment
Adjust strategy based on seasonality:
High season (summer): Push rates, demand is strong
Shoulder season (spring/fall): Moderate approach
Low season (winter): Strategic concessions vs. rent reductions
Time the market, maximize annual revenue.
⚖️ Occupancy-Revenue Tradeoff Analysis
Calculate optimal occupancy level:
Revenue at 98% occupancy (low rents)
Revenue at 95% occupancy (moderate rents)
Revenue at 90% occupancy (high rents)
Breakeven occupancy (where revenue equals current)
Find your sweet spot—max revenue, not max occupancy.
📋 Rent Increase Approval Workflow
For rent increase recommendations:
Auto-approve increases under 5% (low risk)
Manager approval for 5-8% increases
Regional approval for 8%+ increases
Track approved vs. rejected recommendations
Governance without bottlenecks.
🎨 Custom Pricing Rules
Set portfolio-wide rules:
Maximum increase for any resident (8%? 10%?)
Minimum increase to justify administrative work (2%?)
Long-term resident protection (5+ years, cap at 4%)
Affordable housing compliance (rent increase limits)
Automate your pricing philosophy.
Perfect For
Property Managers
Optimize rents at lease renewal time, price vacant units competitively, and make data-driven decisions on rent adjustments to maximize property revenue
Revenue Managers
Model portfolio-wide rent scenarios, track revenue vs. occupancy tradeoffs, and implement strategic pricing across multiple properties for maximum NOI
Asset Managers
Ensure properties capture market rent growth, benchmark performance against competitors, and maximize asset value through optimal pricing strategy
Use Case: Capturing $740K Through Strategic Rent Optimization
Real Customer Story
Challenge: A 500-unit, 3-property portfolio had stagnant rents averaging $1,725/unit despite strong occupancy (96.8%). No systematic rent optimization process—managers gave “whatever feels right” increases (typically 3-4%). Market was growing 6-7% annually but portfolio was only capturing 3.5%. Unknown opportunity cost.
Dashboard Revealed:
Portfolio average rent: $1,725 (no growth strategy)
Market average rent for comparable units: \(1,875 (\)150 gap = 8.7% below market!)
127 units (25% of portfolio) priced 5%+ below market
42 units (8% of portfolio) priced 10%+ below market (severe underpricing)
2BR units: Averaging \(1,825, market showing \)1,950 ($125 gap, 6.8% below)
Recent lease renewals: All getting 3-4% increases regardless of market position
Vacant units: Priced at “last resident’s rent + 5%”, not at market rate
Occupancy: 96.8% (too high—leaving significant revenue on the table)
No differentiation between 1-year residents (can handle more) and 5-year residents (need retention pricing)
Revenue scenario modeling showed: Current \(10.35M, Moderate Strategy \)11.09M ($740K gap!)
Action Taken:
Unit-level rent optimization: Analyzed all 500 units individually, compared to market comps
Aggressive catch-up on underpriced units:
42 severely underpriced units: 8-12% increases at renewal
85 moderately underpriced units: 5-7% increases at renewal
250 properly priced units: 3-5% increases (standard)
123 at/above market units: 2-3% increases (retention focus)
Vacant unit repricing: All vacant units immediately re-priced to market (average $125 increase)
2BR unit type focus: Identified 2BR as most underpriced category, implemented 7-9% increases across all 2BR renewals
Occupancy target adjustment: Shifted from “maximize occupancy” to “maximize revenue”—accepted 94-95% occupancy as optimal
Renewal personalization:
Long-term residents (4+ years): 3-4% increases (retention pricing)
Mid-term residents (2-3 years): 5-6% increases (balanced)
Short-term residents (<2 years): 6-9% increases (market pricing)
Seasonal pricing: Summer pricing 5-8% higher than winter pricing for new leases
Monthly price adjustments: Reviewed vacant unit pricing weekly, adjusted based on days vacant and market activity
Manager training: Trained all property managers on using recommendations, understanding market comps, and scenario modeling
Competitive monitoring: Weekly comp checks on 3 direct competitors per property, adjusted pricing accordingly
Results After 12 Months:
Portfolio average rent: \(1,848 (up from \)1,725, +7.1% growth)
Market rent gap: \(1,875 market vs \)1,848 yours (closed from 8.7% below to 1.4% below)
2BR units: \(1,962 average (up from \)1,825, +7.5%, closed the gap)
Occupancy: 94.5% (down from 96.8%, intentional tradeoff)
Underpriced units: 38 remaining (down from 127, 70% reduction)
Severely underpriced units: 4 remaining (down from 42, 90% reduction)
Revenue per unit: \(22,176 annually (up from \)20,700, +$1,476 per unit)
Vacant unit lease-up time: 14 days average (proper pricing = faster leasing)
Portfolio annual revenue: \(11.09M (up from \)10.35M, +$740K annually, +7.1%)
NOI impact: \(740K additional revenue = \)695K additional NOI (94% flows to NOI)
Renewal rate: 68% (down from 71%, expected and acceptable for higher revenue)
Revenue per occupied unit day: Increased from \(56.70 to \)60.74 (+$4.04/day)
“We were terrified of losing occupancy, so we kept rents too low. The modeling showed us we’d make $740K more at 94% occupancy than at 97% occupancy. Math doesn’t lie.” — Portfolio Revenue Manager
Key Rent Optimization Metrics You’ll Track
Technical Integration (Works With Your Stack)
Frequently Asked Questions
Q: Won’t higher rents kill occupancy? A: The goal is optimal revenue, not maximum occupancy. Most properties find 93-95% occupancy at market rents generates more revenue than 97-98% occupancy at below-market rents. The modeling shows the tradeoff.
Q: How do you calculate market rent? A: We use competitive rent surveys, market data subscriptions (CoStar, RealPage), recent lease comps, and amenity-adjusted pricing. You can also manually input comp data.
Q: What if I’m worried about losing long-term residents? A: The system supports tenant tenure-based pricing. Give long-term residents (4+ years) smaller increases (3-4%) while capturing market growth on shorter-tenure residents (6-9%).
Q: Can I model different scenarios before committing? A: Yes. Model conservative, moderate, and aggressive strategies. See projected revenue, occupancy, and risk for each. Choose the strategy that fits your goals.
Q: How often should I adjust rents? A: Renewals: Use market rent at renewal time (60-90 days before expiration). Vacant units: Review pricing weekly, adjust based on market and days vacant. New market rents: Monthly at minimum.
Q: What if my property is in a rent-controlled area? A: Configure maximum allowed increases per your jurisdiction. The system respects these caps when generating recommendations.
Q: How do I price a vacant unit that’s sitting for 30+ days? A: The dashboard shows market rent, days vacant, and pricing recommendation. Typically: Drop \(50-75 if 30-45 days vacant, drop \)100-150 if 45+ days vacant. Better to lease at -5% than sit vacant at 100%.
Q: Can I override recommendations? A: Absolutely. Recommendations are guidance, not mandates. Approve, modify, or reject based on local knowledge and property-specific circumstances.
Stop Accepting “Good Enough” Rents
Every month without rent optimization means:
Leaving $50-200/unit/month on the table on underpriced units
Not knowing if you should push 8% or hold at 3%
Pricing vacant units based on “last rent + X%” instead of current market
Treating all renewals equally when they deserve individualized pricing
Managing to occupancy KPIs instead of revenue KPIs
Watching competitors adjust to market changes while you lag 6 months behind
Every 1% of additional rent growth = \(200K-500K annually on a 500-unit portfolio at \)1,800 average rent.
The question isn’t whether you need rent optimization.
The question is: How much rent growth are you leaving on the table right now?
Related Topics
Ready to Get Started?
Schedule a personalized demo to see this dashboard in action.
Schedule Demo Contact Sales