Cost Control Efficiency Dashboard
Stop tolerating hidden cost inefficiencies. Compare expense performance across your portfolio, benchmark against industry standards, track vendor concentration, optimize marketing spend, and identify waste. Most portfolios find 3-5% NOI margin improvement ($300K-500K+ annually) through better cost visibility and control.
Getting Started
1️⃣ Connect Your Systems Link your property management, accounting, and vendor management systems. We’ll automatically map all expense categories and vendors.
2️⃣ Import Historical Data Pull in 24 months of expense data across all properties. This establishes your baseline expense ratios, vendor spend patterns, and trends.
3️⃣ Set Benchmarks & Targets Configure your target expense ratios, budget thresholds, and industry benchmarks. Set alerts for when properties exceed tolerances.
4️⃣ Start Optimizing Day one: See your expense ratios and variance. Week one: Identify your biggest cost inefficiencies. Month one: Implement your first cost-saving initiative with data backing it up.
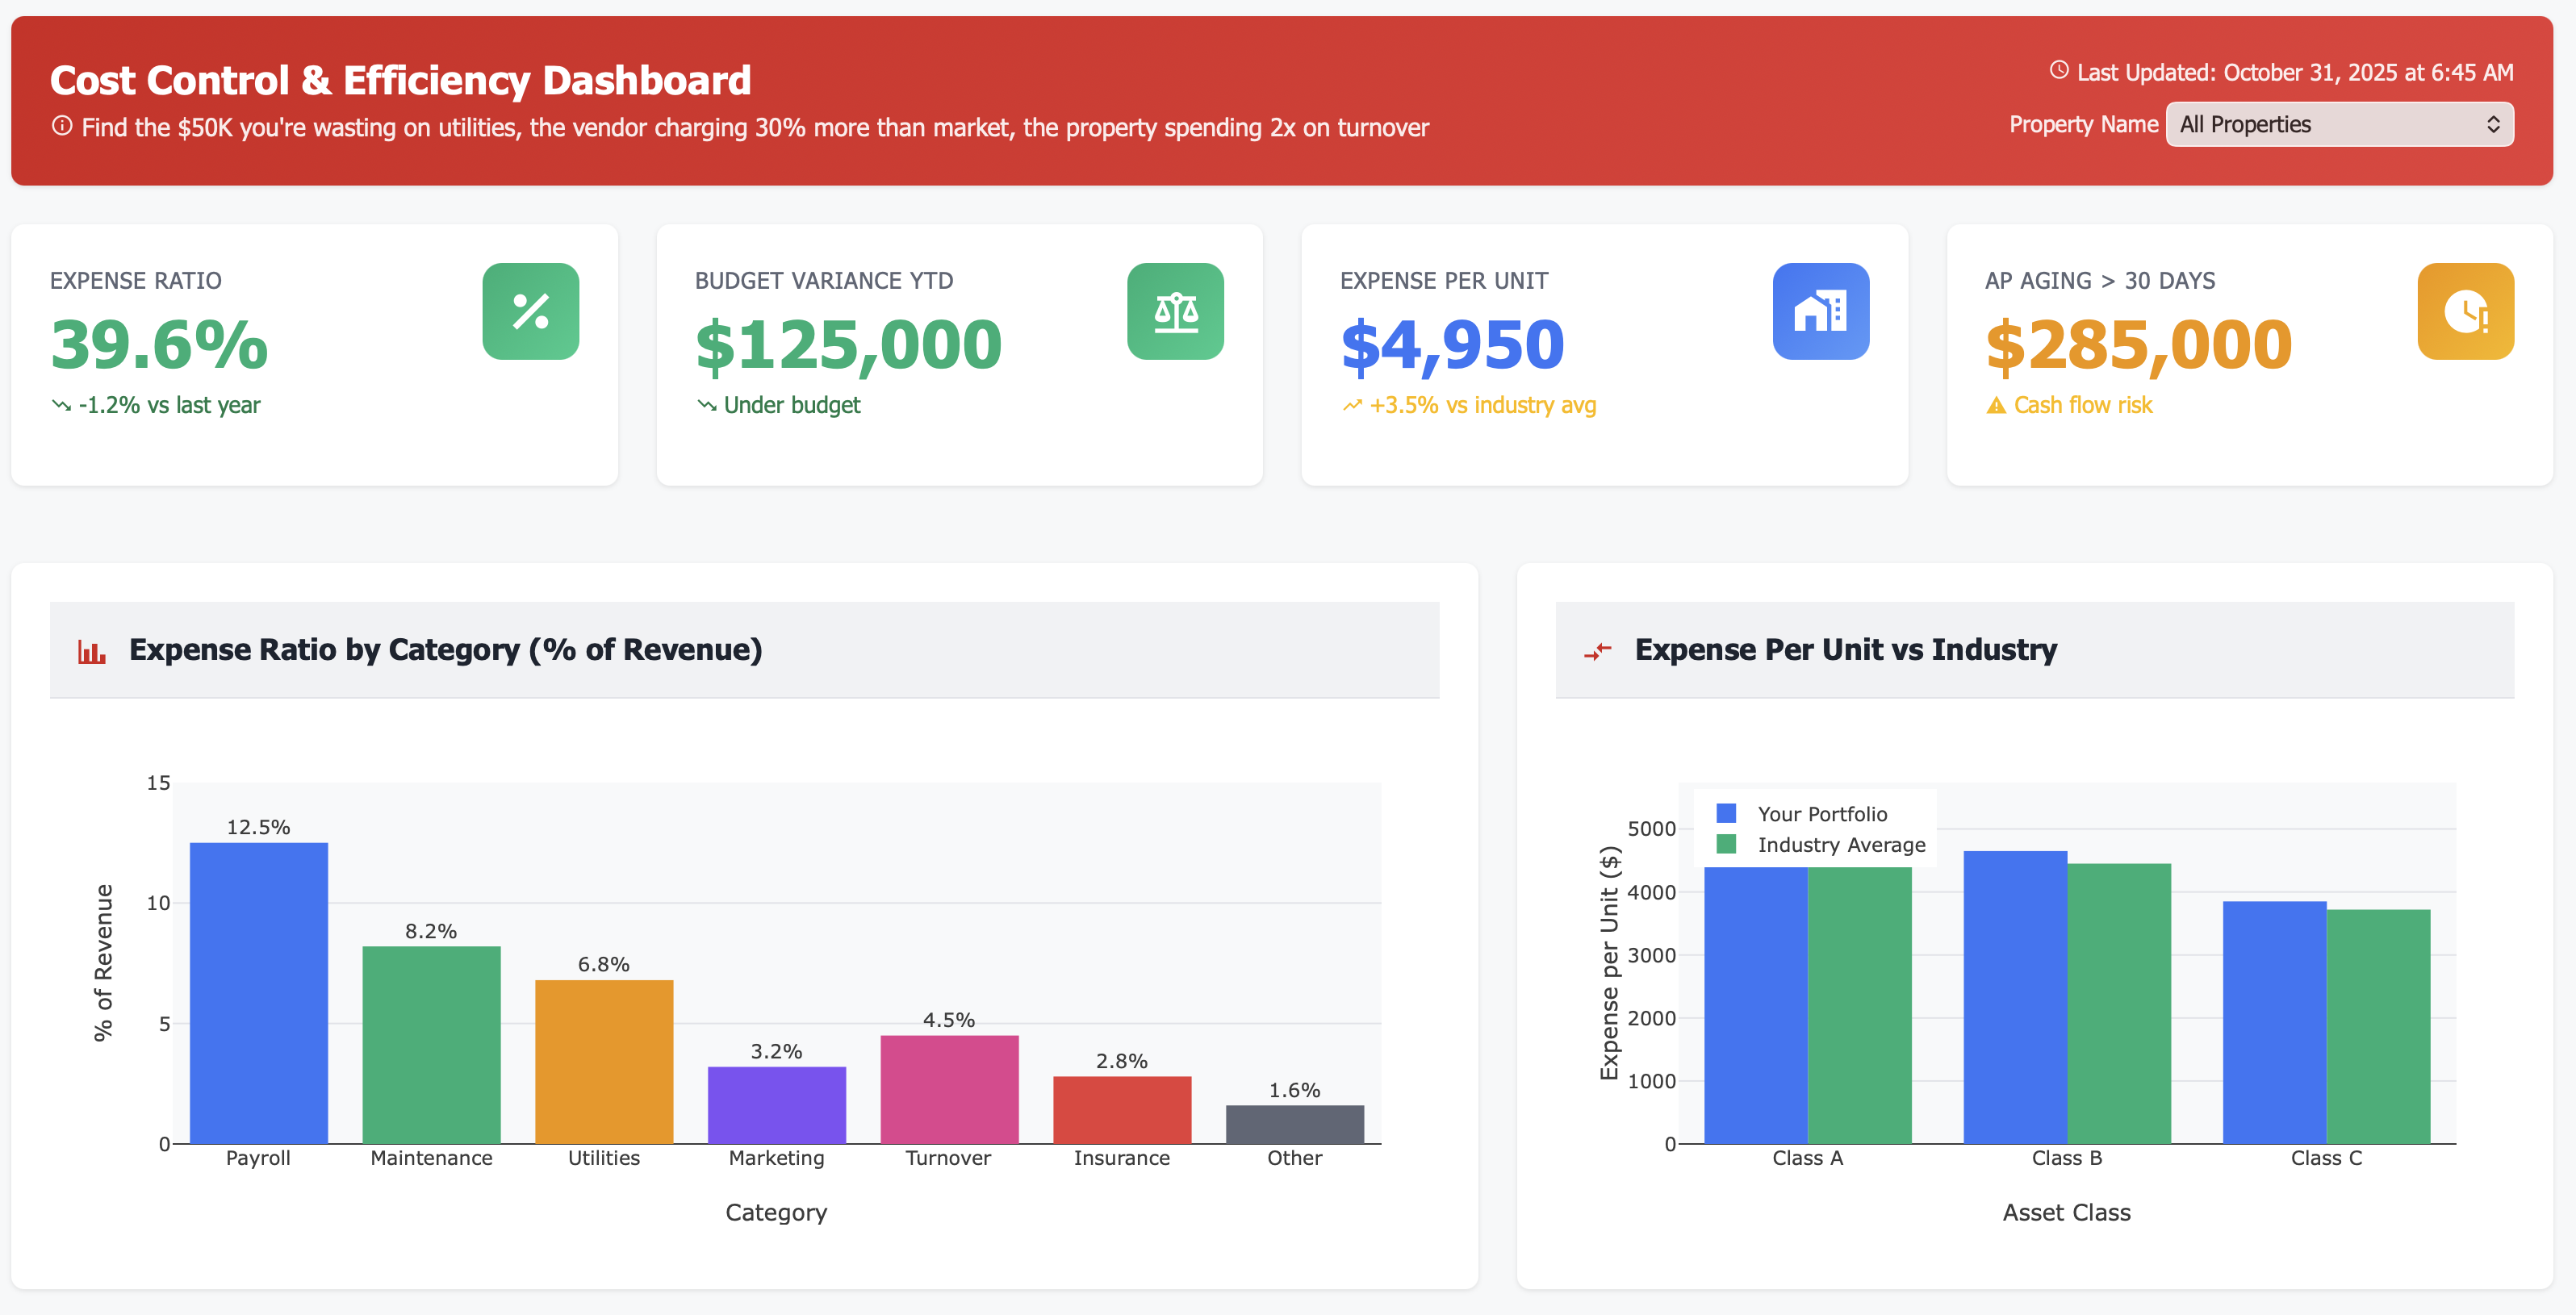
Find the Money You’re Wasting: Cost Control & Efficiency
Find the $50K in utility overspend, the vendor charging 30% above market, and the property spending 2x on turnover—automatically.
Benchmark every expense against your portfolio and industry standards. Know instantly which properties are efficient and which are bleeding cash.
Track expense ratios, budget variance, vendor concentration, marketing ROI, and cash flow—all the metrics CFOs and owners actually care about.
The Cost Control Blindspot Killing Your Returns
If you’re managing a multifamily portfolio, hidden inefficiencies are destroying your NOI:
⚠️ Portfolio-wide blindness: No way to compare expense performance across properties
⚠️ Vendor concentration risk: 68% of spend with top 3 vendors and you had no idea
⚠️ Marketing waste: Spending \(850 per lease on Instagram vs \)185 on referrals
⚠️ Utility budget bleeding: $51K over budget on utilities and can’t explain why
⚠️ Payroll inefficiency: One property spending \(2,450/unit on payroll vs \)1,750 at another
⚠️ Insurance shock: Premiums up 79% in 5 years with no visibility into the trend
⚠️ AP aging crisis: Cash flow problems brewing but won’t show up until too late
Poor cost control = 3-5% NOI margin loss across your portfolio. Time to plug the leaks.
Your New Reality: Complete Cost Intelligence
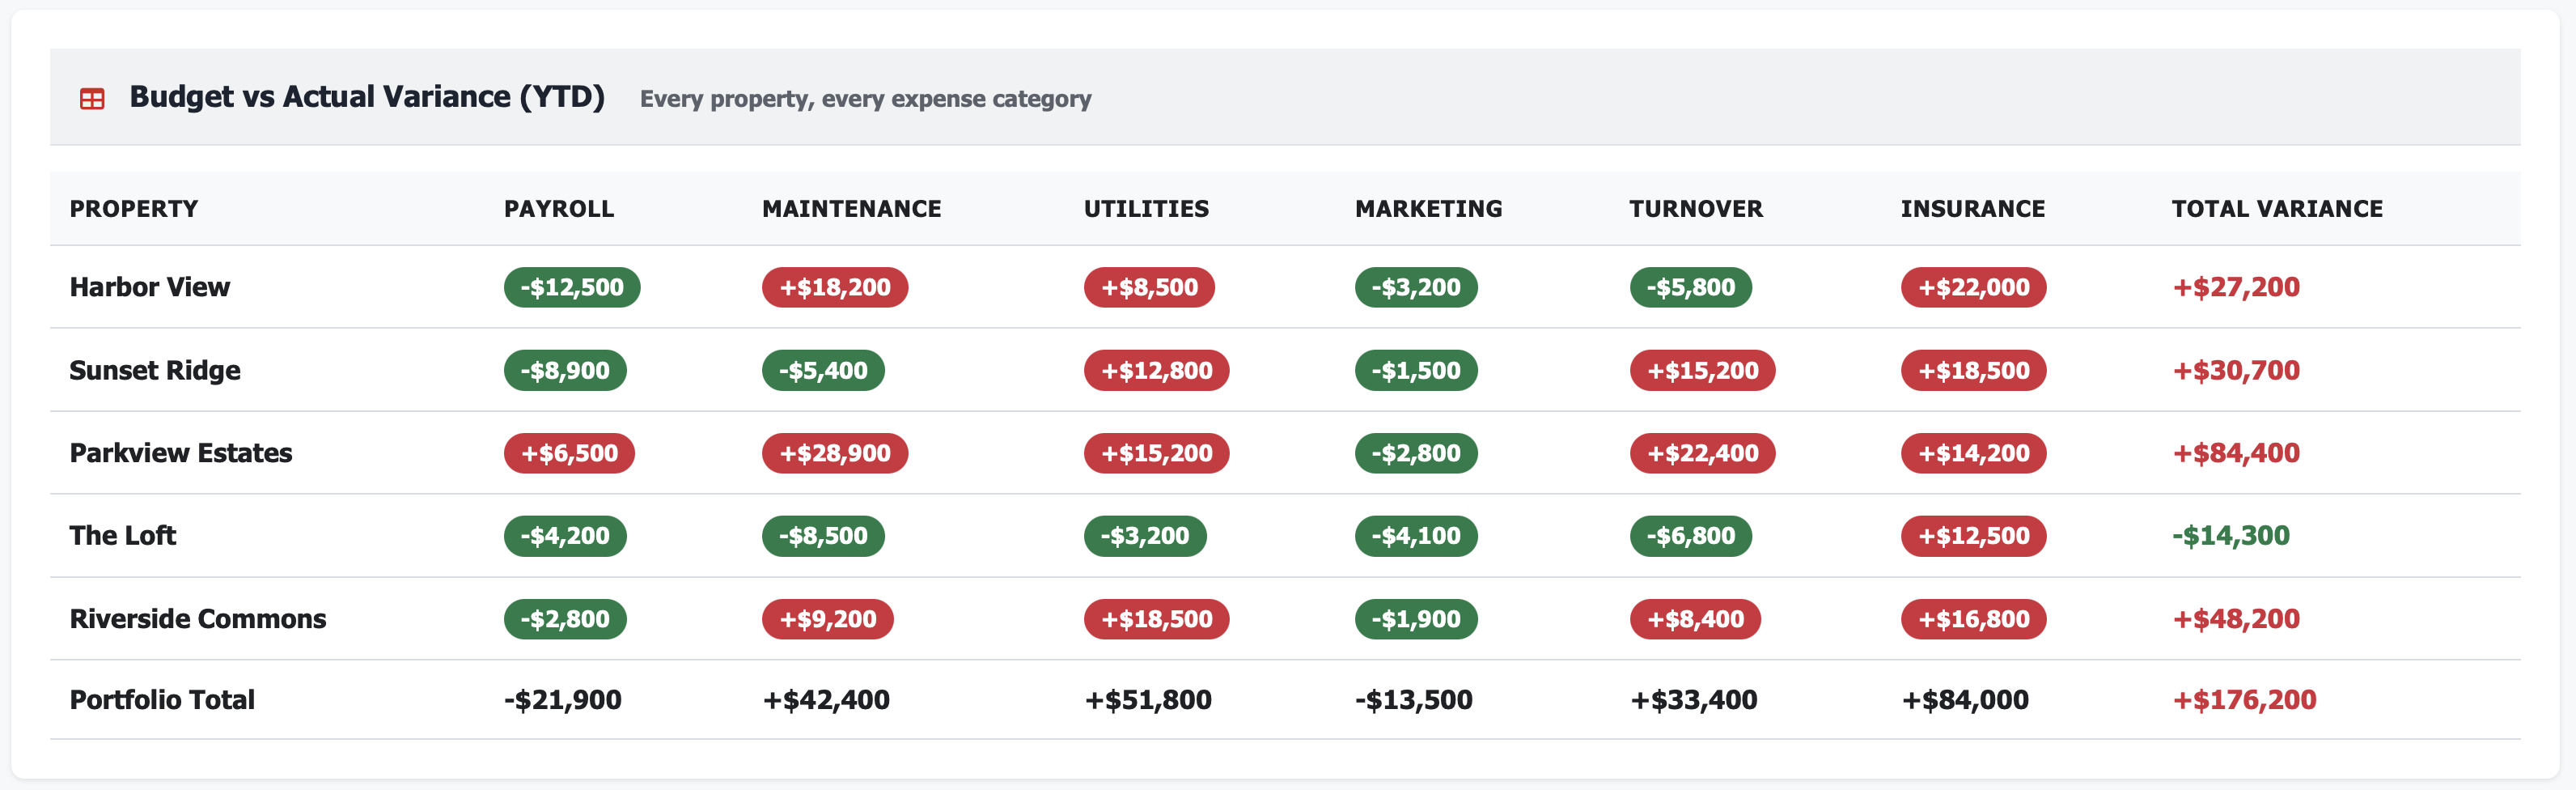
Portfolio-Wide Budget Variance
Every property, every category:
Payroll variance by property
Maintenance variance by property
Utilities, marketing, turnover, insurance
Total variance rolled up
Instant identification of problem properties
See which properties are on budget and which are over
Unit Cost Trend
Compare against standards:
Your expense trend
Compared against weather information
Portfolio-wide expense ratio
Category-level expense ratios
Know if you’re competitive or overspending
Vendor Concentration Analysis
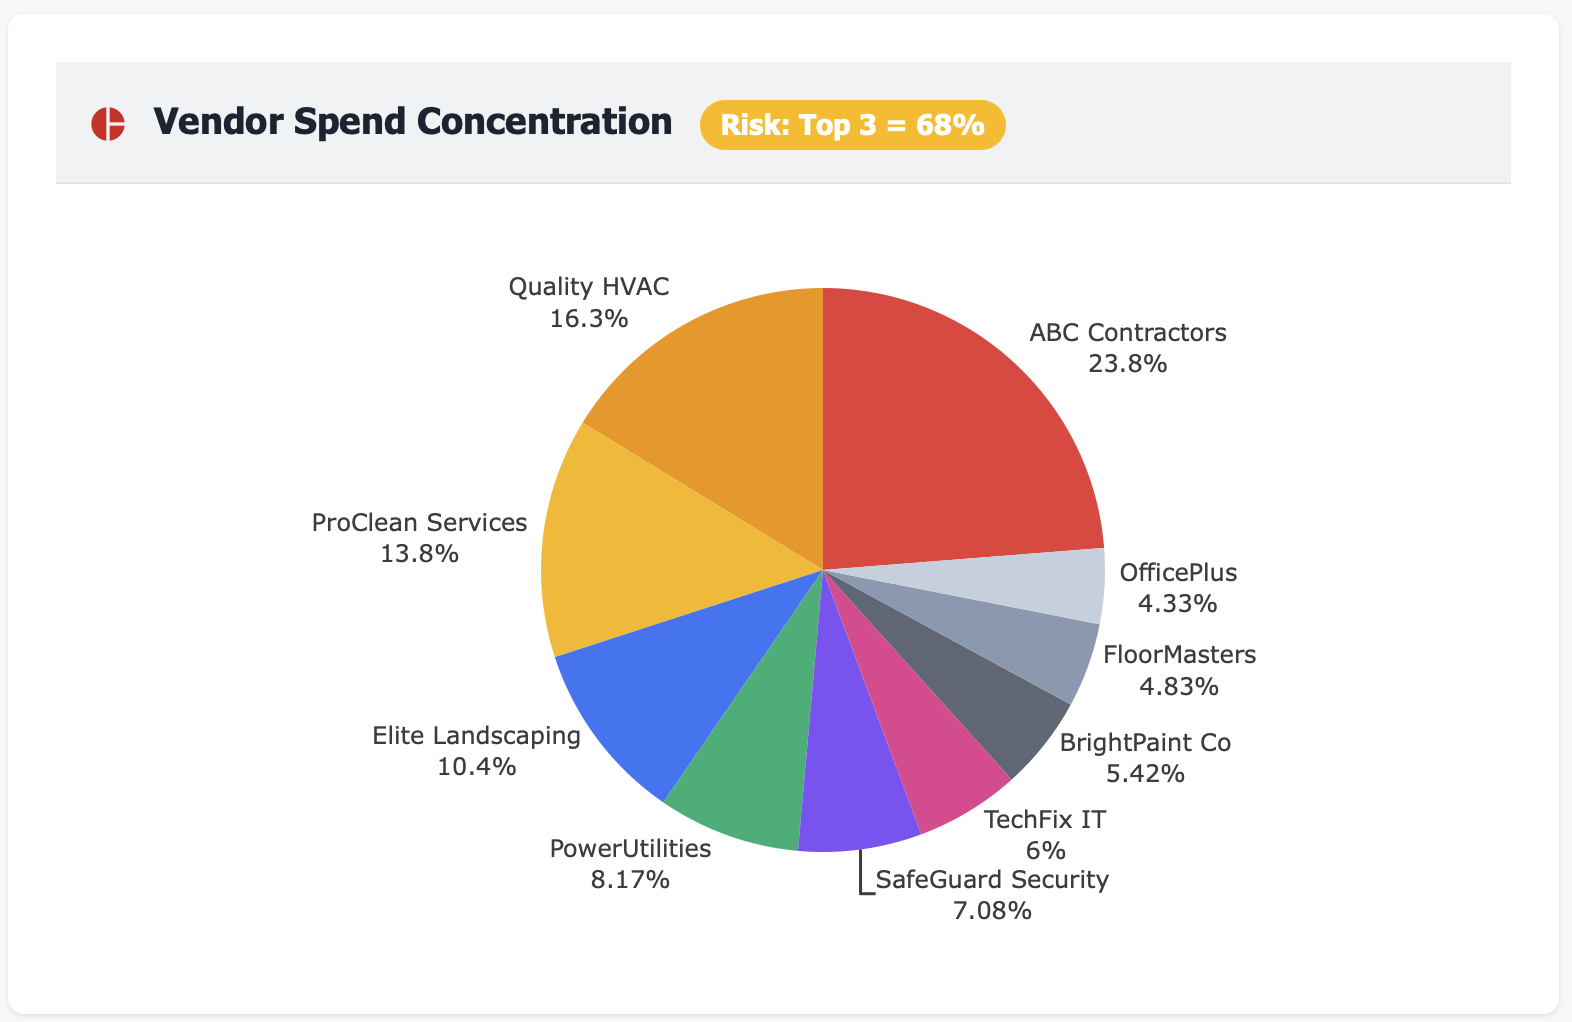
Understand spend risk:
Top 10 vendor spend breakdown
Concentration percentage
Risk identification (top 3 = 68%?)
Opportunity for diversification
Negotiate from strength with real data
Real Results: From Cost Chaos to Controlled Excellence
Metric |
Before Cost Control Dashboard |
After 12 Months |
|---|---|---|
Portfolio expense ratio |
42.5% (unoptimized) |
39.8% (2.7% improvement) |
Expense per unit variance |
Unknown across properties |
Identified & reduced 18% |
Vendor spend visibility |
Manual tracking, incomplete |
Complete transparency |
Marketing cost per lease |
$685 average (inefficient) |
$425 average (optimized) |
Utility budget accuracy |
±$51K variance (8.5%) |
±$12K variance (2%) |
Time on cost analysis |
15 hours/month |
2 hours/month |
Annual cost savings identified |
— |
$487K across portfolio |
Features That Transform Cost Management
📊 Expense Ratio by Category
See what percentage of revenue each expense category consumes:
Payroll: 12.5% of revenue
Maintenance: 8.2% of revenue
Utilities: 6.8% of revenue
Marketing: 3.2% of revenue
Benchmark against targets and industry standards.
💰 Budget vs Actual Variance Tracking
Matrix view showing every property against every expense category. Red = over budget, green = under budget. Spot problems instantly. Roll up to portfolio totals.
🏢 Property-Level Benchmarking
Compare expense per unit, payroll efficiency, and other metrics across all properties. Identify outliers. Understand why Property A spends \(1,750/unit on payroll while Property B spends \)2,450/unit.
📈 Vendor Spend Concentration
Pie chart showing your top 10 vendors and their share of total spend. Identify concentration risk. See opportunities for vendor consolidation or diversification. Negotiate better rates with data.
🎯 Marketing ROI by Channel
Cost per lease for every marketing channel:
Referrals: $185 per lease
Google Ads: $425 per lease
Instagram: $850 per lease
Shift budget to high-performing channels.
⚡ Utilities Cost Trend Analysis
12-month utility cost trends with weather-normalized expectations and budget comparison. See if you’re overspending due to actual consumption or just weather. Identify unusual spikes early.
👥 Payroll Efficiency Tracking
Payroll cost per unit compared to revenue per unit for each property. Understand staffing efficiency. Identify properties that are over-staffed or under-staffed.
🛡️ Insurance Cost Trends
Multi-year insurance premium tracking showing year-over-year increases. See the 79% increase since 2020. Plan for future renewals. Shop policies with historical data.
🔨 CapEx Spend Tracking
Budget vs actual for major capital projects:
Roofing: \(172K spent of \)185K budget
HVAC: \(158K spent of \)145K budget (over)
Parking lot: \(102K spent of \)95K budget (over)
Stay on top of major expenditures.
💳 Accounts Payable Aging
See which properties are paying vendors on time (cash flow health indicator):
Current (0-30 days)
31-60 days
61-90 days
90+ days (danger zone)
Spot cash flow problems before they become crises.
Perfect For
Portfolio Managers
Optimize operations across multiple properties by identifying inefficiencies, benchmarking performance, and controlling costs at scale
CFOs & Controllers
Monitor financial health, track budget variance, manage vendor relationships, and ensure expense discipline across the organization
Asset Managers
Maximize NOI through data-driven cost control, property-level benchmarking, and strategic vendor management
Use Case: Recovering $487K in Annual Cost Inefficiencies
Real Customer Story
Challenge: A 5-property, 1,125-unit portfolio knew costs were “high” but had no systematic way to identify where money was being wasted. Each property operated independently with little benchmarking.
Dashboard Revealed:
Portfolio expense ratio: 42.5% (vs 39% industry target for Class B)
Parkview Estates: \(84,400 over budget YTD (vs The Loft: \)14,300 under budget)
Parkview Estates payroll: \(2,450/unit (vs portfolio avg \)2,050/unit)
Marketing: Instagram costing \(850/lease vs referrals at \)185/lease
Top 3 vendors: 68% of total spend (concentration risk)
Utilities: $51K over budget due to weather and rate increases (no visibility)
Insurance: 79% increase over 5 years (premium tracking nonexistent)
Parkview Estates: 31% of AP over 30 days old (cash flow warning)
Action Taken:
Parkview Estates deep dive: Identified overstaffing (2 more employees than needed), excessive turnover costs, and poor vendor management
Marketing reallocation: Shifted 60% of Instagram budget to referral program and Google Ads
Vendor consolidation: Negotiated portfolio-wide contracts with top 3 vendors (15% reduction)
Utility efficiency program: LED retrofits, smart thermostats, reduced common area lighting hours
Insurance shopping: Used 5-year trend data to shop policies aggressively (found 12% savings)
Payroll optimization: Right-sized staffing at Parkview Estates (eliminated 1.5 FTE through attrition)
Turnover process improvement: Standardized make-ready processes to reduce per-unit costs
Results After 12 Months:
Portfolio expense ratio: 39.8% (down from 42.5%)
Parkview Estates variance: \(84K over \rightarrow \)12K over (89% improvement)
Marketing cost per lease: \(685 \rightarrow \)425 (38% reduction)
Vendor costs: 15% reduction through consolidation ($142K annually)
Utility costs: Back on budget through efficiency ($51K recovered)
Insurance: 12% savings through competitive shopping ($24K annually)
Payroll at Parkview: \(2,450 \rightarrow \)2,100/unit ($87K annually)
Total identified savings: $487K annually across portfolio
NOI margin improvement: 2.7 percentage points
“We knew we had inefficiencies, but had no idea where. The dashboard paid for itself in the first property we fixed.” — Portfolio CFO
Key Cost Control Metrics You’ll Track
Technical Integration (Works With Your Stack)
Frequently Asked Questions
Q: Can I compare properties of different sizes and classes? A: Yes. All metrics are normalized (per unit, % of revenue) so you can compare fairly regardless of property size or class.
Q: How often does expense data update? A: Daily for most systems, real-time for supported integrations. You always have current expense visibility.
Q: Can I export reports for ownership/investors? A: Absolutely. One-click exports to PDF, Excel, PowerPoint. Schedule automated monthly cost control reports.
Q: Does this replace my accounting system? A: No. Your team still uses their existing tools. The dashboard aggregates and analyzes that data for better decision-making and benchmarking.
Q: Can I set custom expense categories? A: Yes. Map your chart of accounts to our categories or create custom categories that match your reporting structure.
Q: What if properties use different vendors? A: Perfect use case. The dashboard shows all vendors across all properties, making it easy to identify consolidation opportunities.
Stop Managing Costs Blindly
Every month without cost intelligence means:
Inefficiencies compounding across your portfolio
Properties overspending with no accountability
Vendor costs higher than they should be
Marketing budget wasted on low-ROI channels
Expense ratios drifting higher without intervention
Your best-performing portfolios have tight cost control through continuous monitoring.
The question isn’t whether you need cost visibility.
The question is: How much inefficiency are you tolerating right now?
Related Topics
Ready to Get Started?
Schedule a personalized demo to see this dashboard in action.
Schedule Demo Contact Sales