Budget vs Actual Dashboard
Stop month-end budget surprises. Track expenses vs budget in real-time with category-level variance analysis. Identify overruns early when you can still fix them. Most properties improve year-end budget accuracy from ±8% to ±2% and save 10+ hours monthly on financial reporting.
Getting Started
1️⃣ Connect Your Systems Link your accounting/PMS system and upload your annual budget. We map your chart of accounts to our category structure.
2️⃣ Import Historical Data We pull in current year data plus 1-2 years of historical spending for baseline comparison and trend analysis.
3️⃣ Set Your Thresholds Define acceptable variance levels by category. Some categories have tighter tolerances (insurance, payroll) vs others (maintenance).
4️⃣ Start Managing Proactively Day one: See your current YTD variance. Week one: Identify your problem categories. Month one: Catch and fix your first budget issue before month-end.
Stop Budget Surprises: Real-Time Expense Intelligence
Stop waiting for accounting to close the books. See exactly where you stand against budget—today, this week, this month—with real-time variance tracking.
Identify budget problems when there’s still time to fix them. See which categories are bleeding money before they blow up your NOI.
When ownership asks “why are we over budget?”, have the answer ready. Detailed category analysis and trend data at your fingertips.
The Budget Nightmare You’re Living
If you’re managing property finances, these problems are costing you credibility and cash:
⚠️ Month-end surprises: Discover you’re $27K over budget when it’s too late to fix it
⚠️ Category blindness: No idea which expense categories are the problem until quarterly review
⚠️ Death by spreadsheet: Stitching together budget reports from 5 different sources
⚠️ Explanation scramble: Ownership calls asking about variance and you’re frantically pulling data
⚠️ Reactive management: Finding out about insurance premium increases after they hit
⚠️ Inability to forecast: Can’t predict year-end results because monthly trends are invisible
Every week without budget visibility = less time to course-correct. Time to see clearly.
Your New Reality: Budget Control at Your Fingertips
Monthly Budget vs Actual Trends
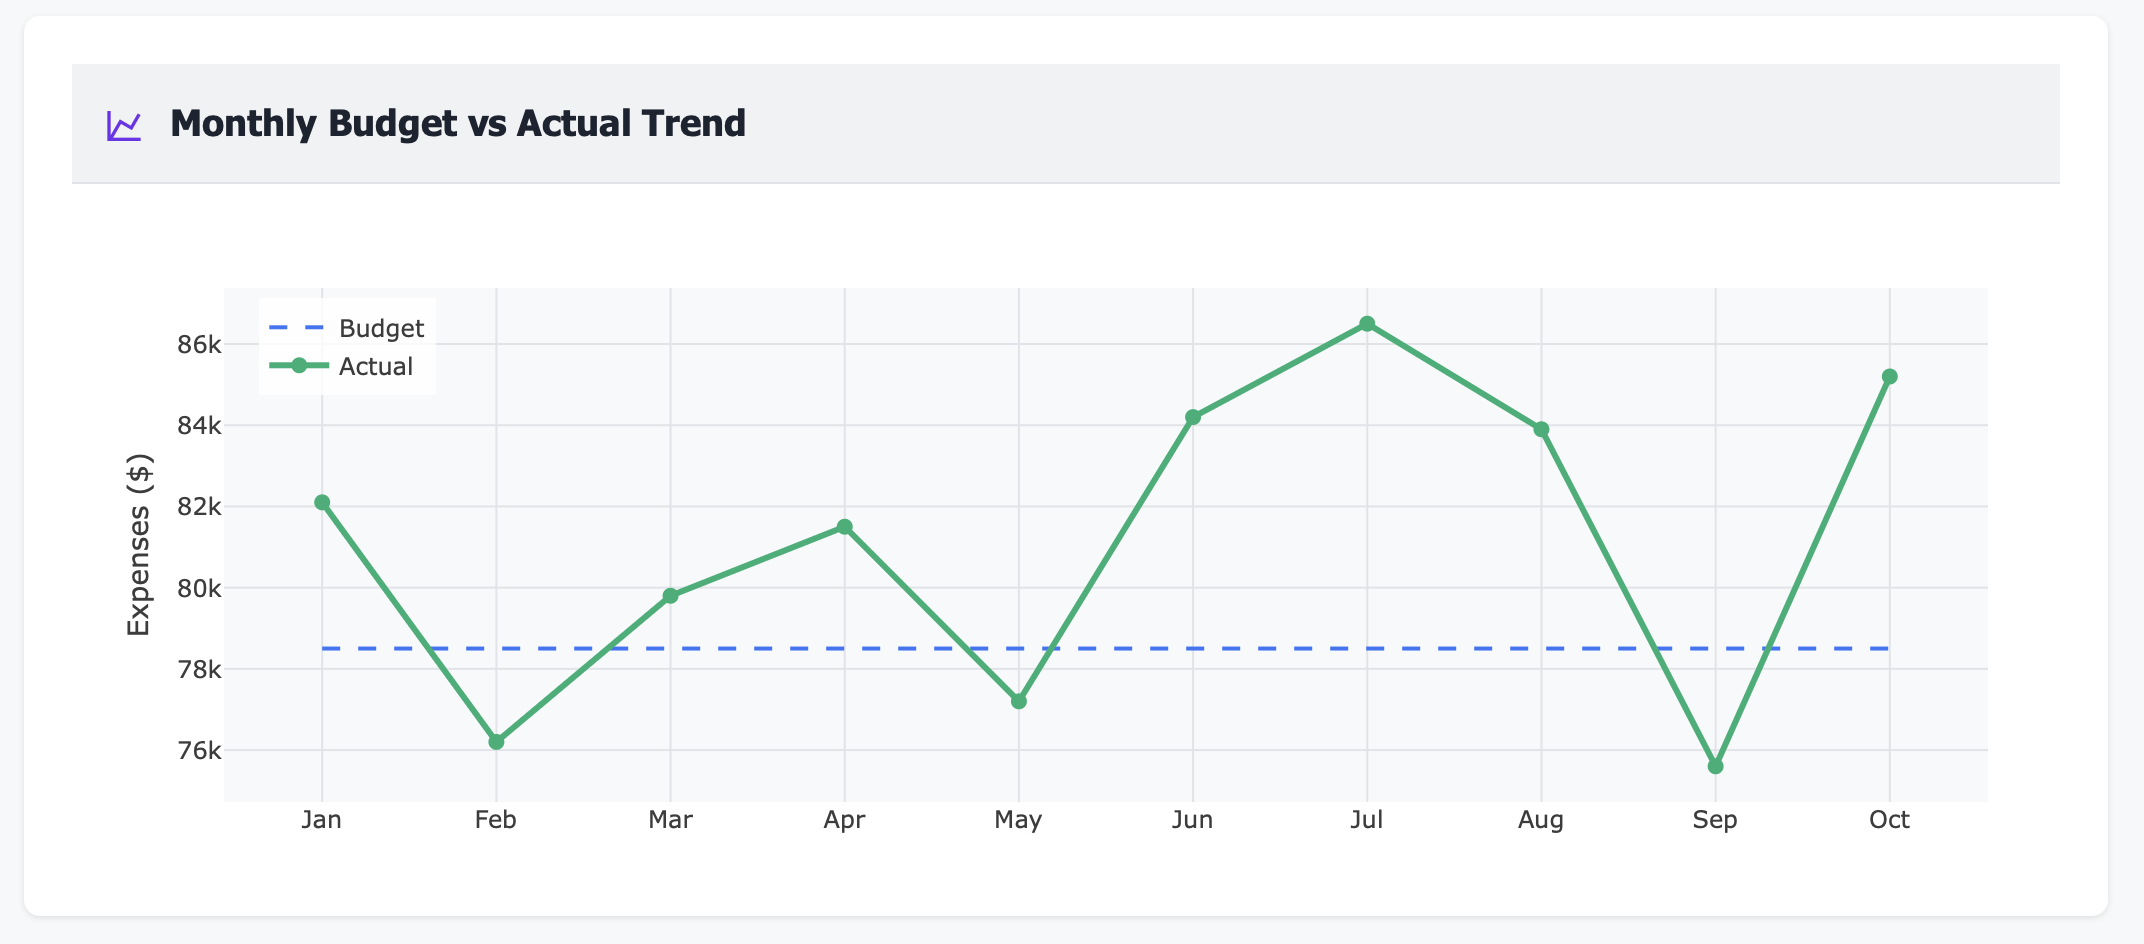
Track performance over time:
Budgeted vs actual line comparison
Monthly variance at a glance
Trend identification (getting better or worse?)
Year-to-date cumulative view
Spot problems before they become crises
Category Expense Breakdown
Understand your spend mix:
Payroll, maintenance, utilities, insurance, etc.
Percentage of total for each category
YTD spending by category
Quick identification of the largest cost drivers
Know where every dollar goes
Variance Analysis by Category
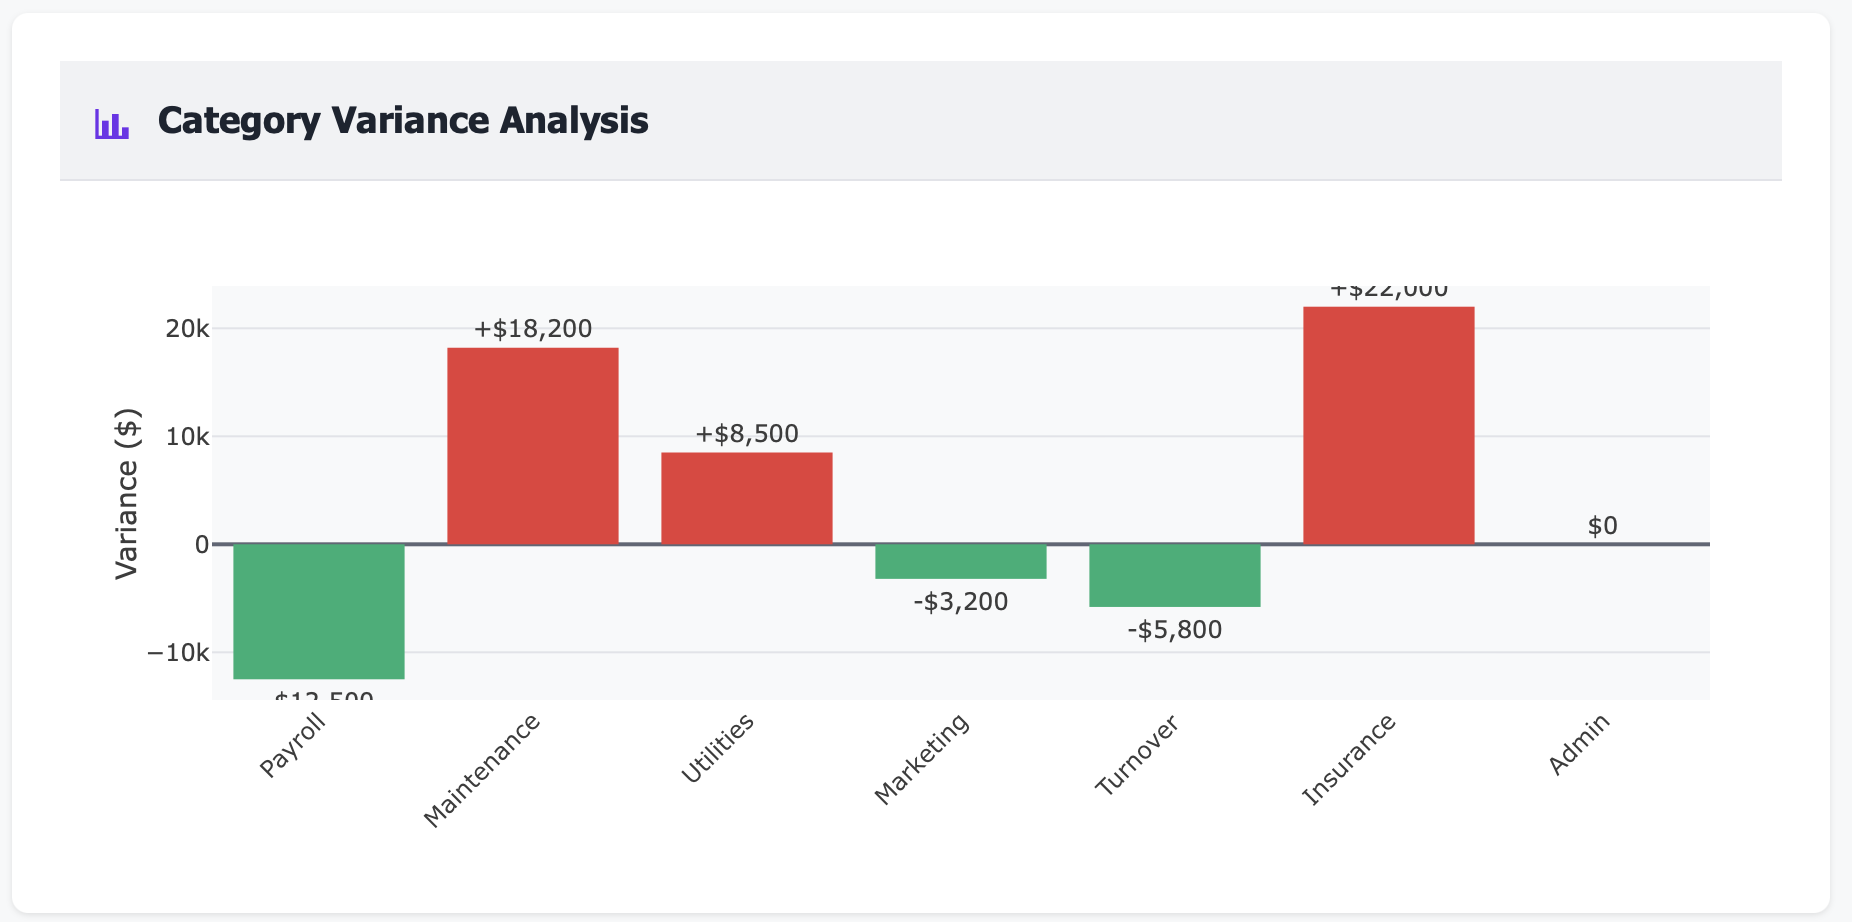
See exactly where you’re off track:
Over-budget categories (red bars)
Under-budget categories (green bars)
Dollar amount variance by category
Immediate visibility into problem areas
Prioritize your corrective actions
Real Results: From Budget Chaos to Financial Control
Metric |
Before Budget Dashboard |
After 6 Months |
|---|---|---|
Budget variance discovery |
25-30 days after month-end |
Real-time, daily |
Time spent on reports |
12 hours/month |
2 hours/month |
Unexpected overruns |
3-4 per year |
0 (caught early) |
Owner/investor confidence |
“What’s happening?” |
“Best reporting we’ve seen” |
Year-end budget accuracy |
±8% variance |
±2% variance |
Ability to forecast Q4 |
Guesswork |
Data-driven projections |
Features That Give You Control
📊 Real-Time Budget Tracking
See your current position against budget at any moment. No more waiting for month-end close. Budget updates flow automatically from your PMS and accounting systems.
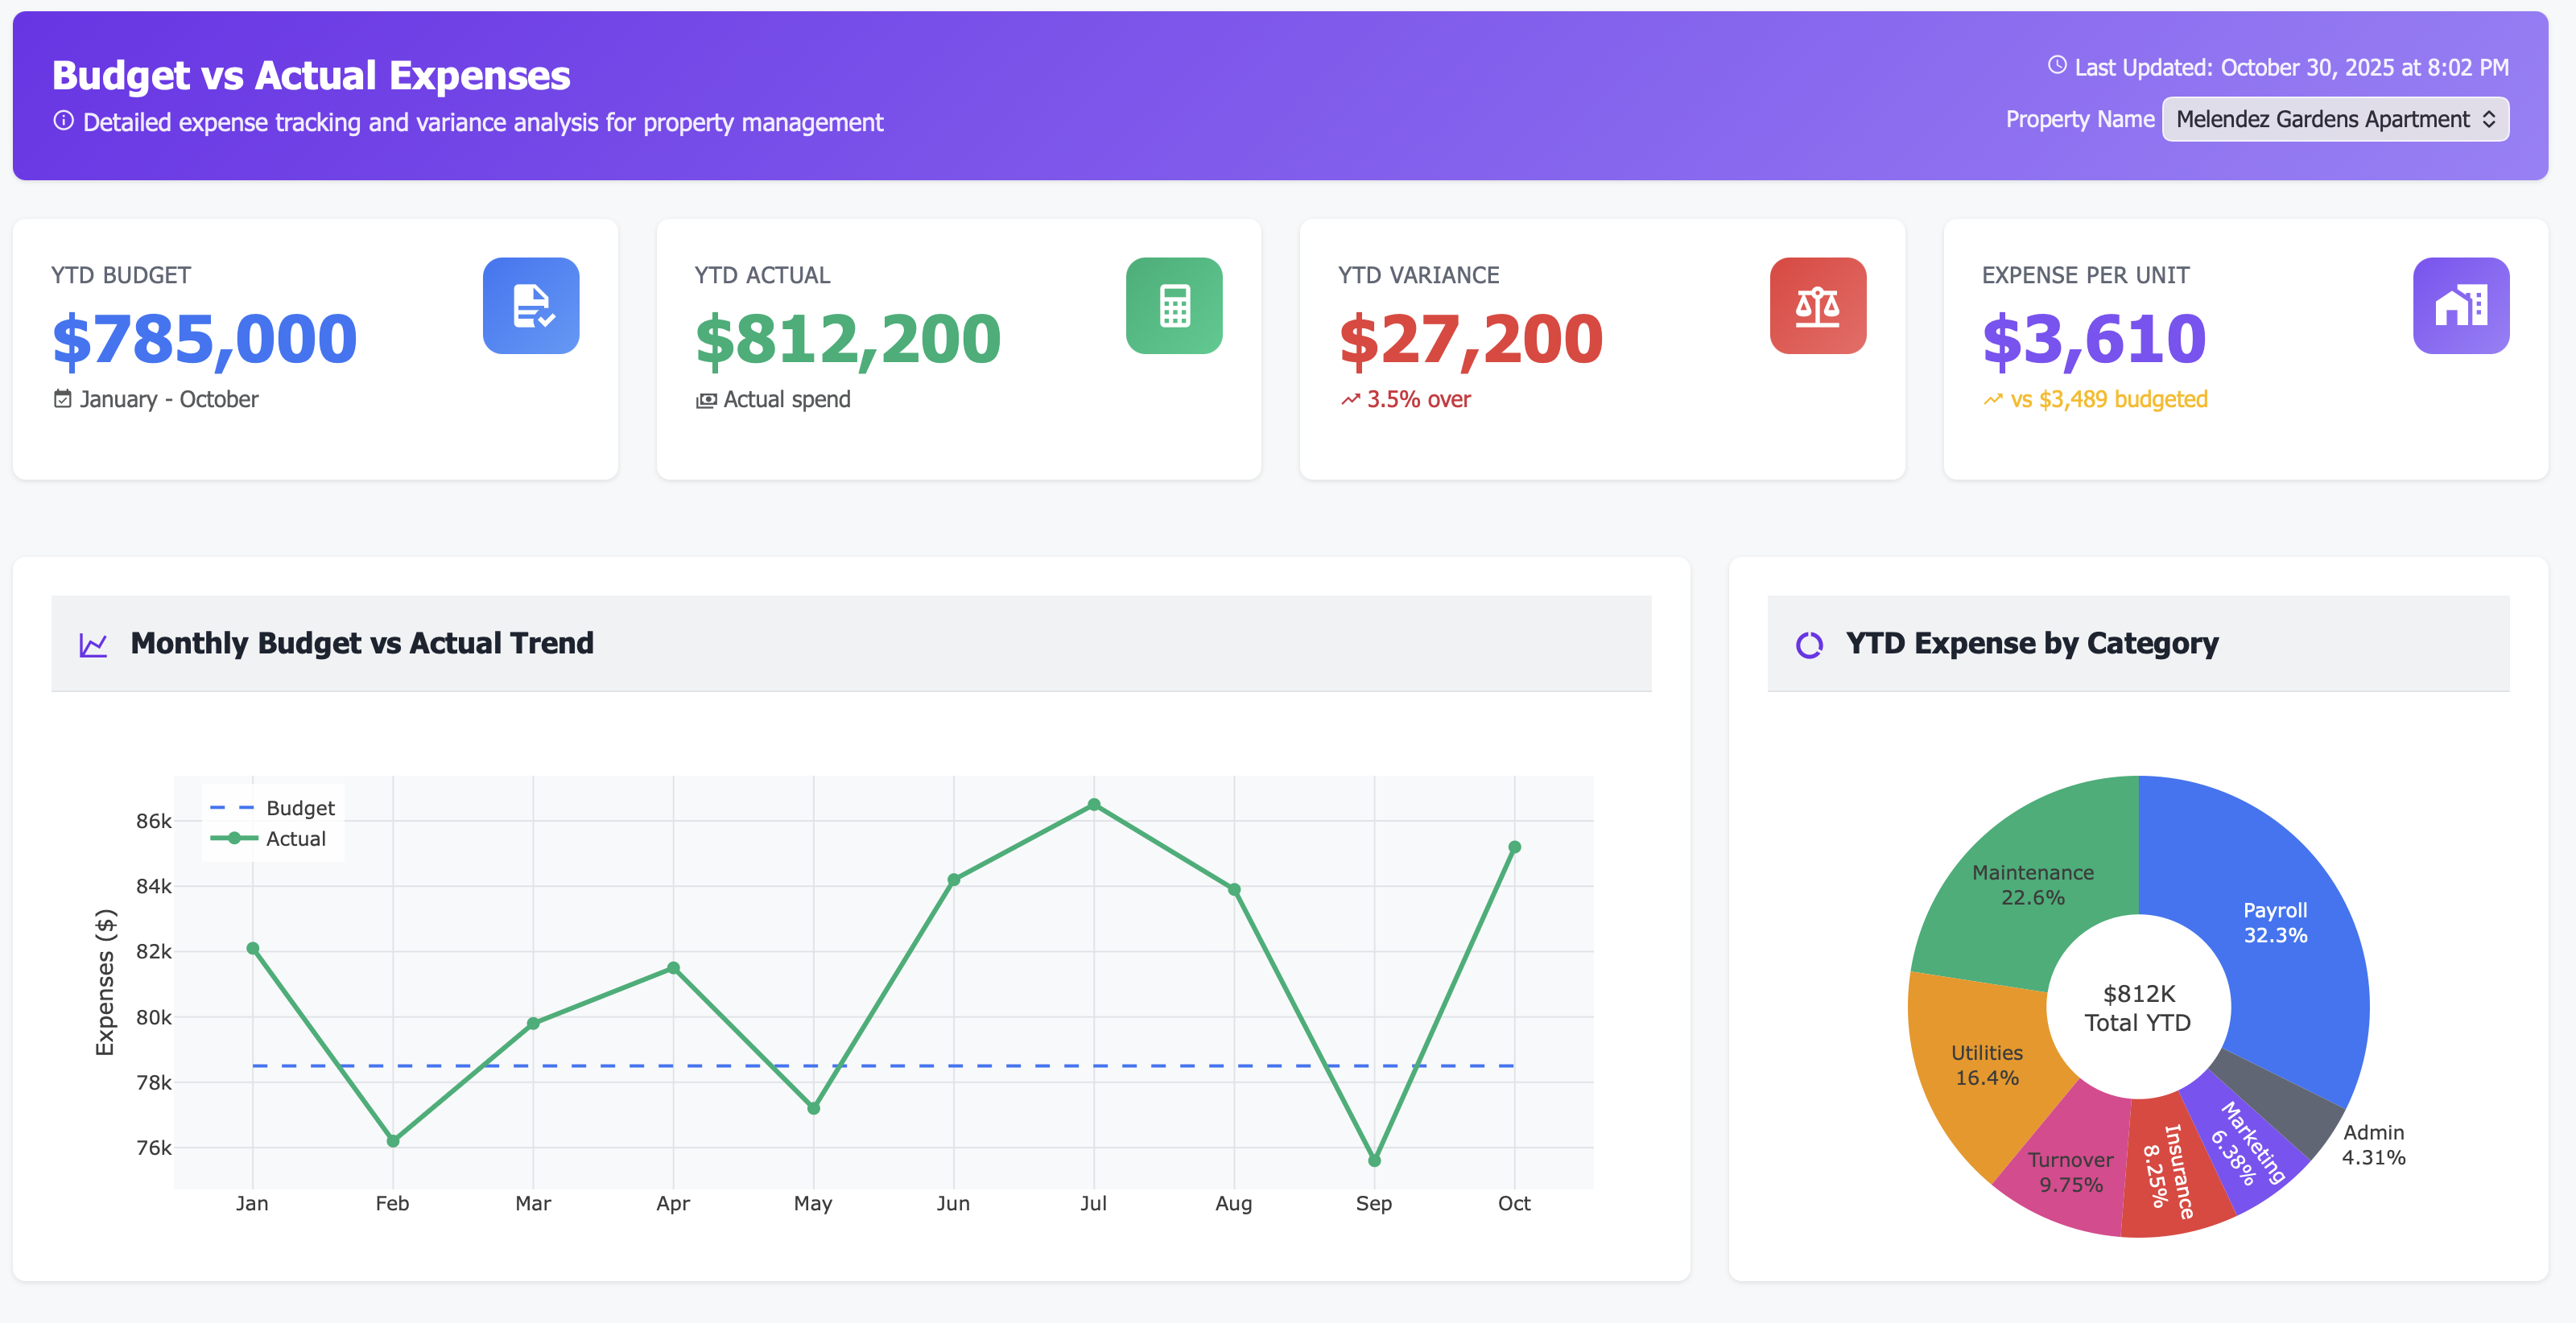
💰 YTD Summary Metrics
Four critical numbers always visible:
YTD Budget: What you planned to spend
YTD Actual: What you’ve actually spent
YTD Variance: The gap (over or under)
Expense Per Unit: Normalized spending view
📈 Monthly Trend Analysis
12-month rolling view of budget vs actual. See seasonal patterns, identify months where you consistently run over, and spot emerging problems before they compound.
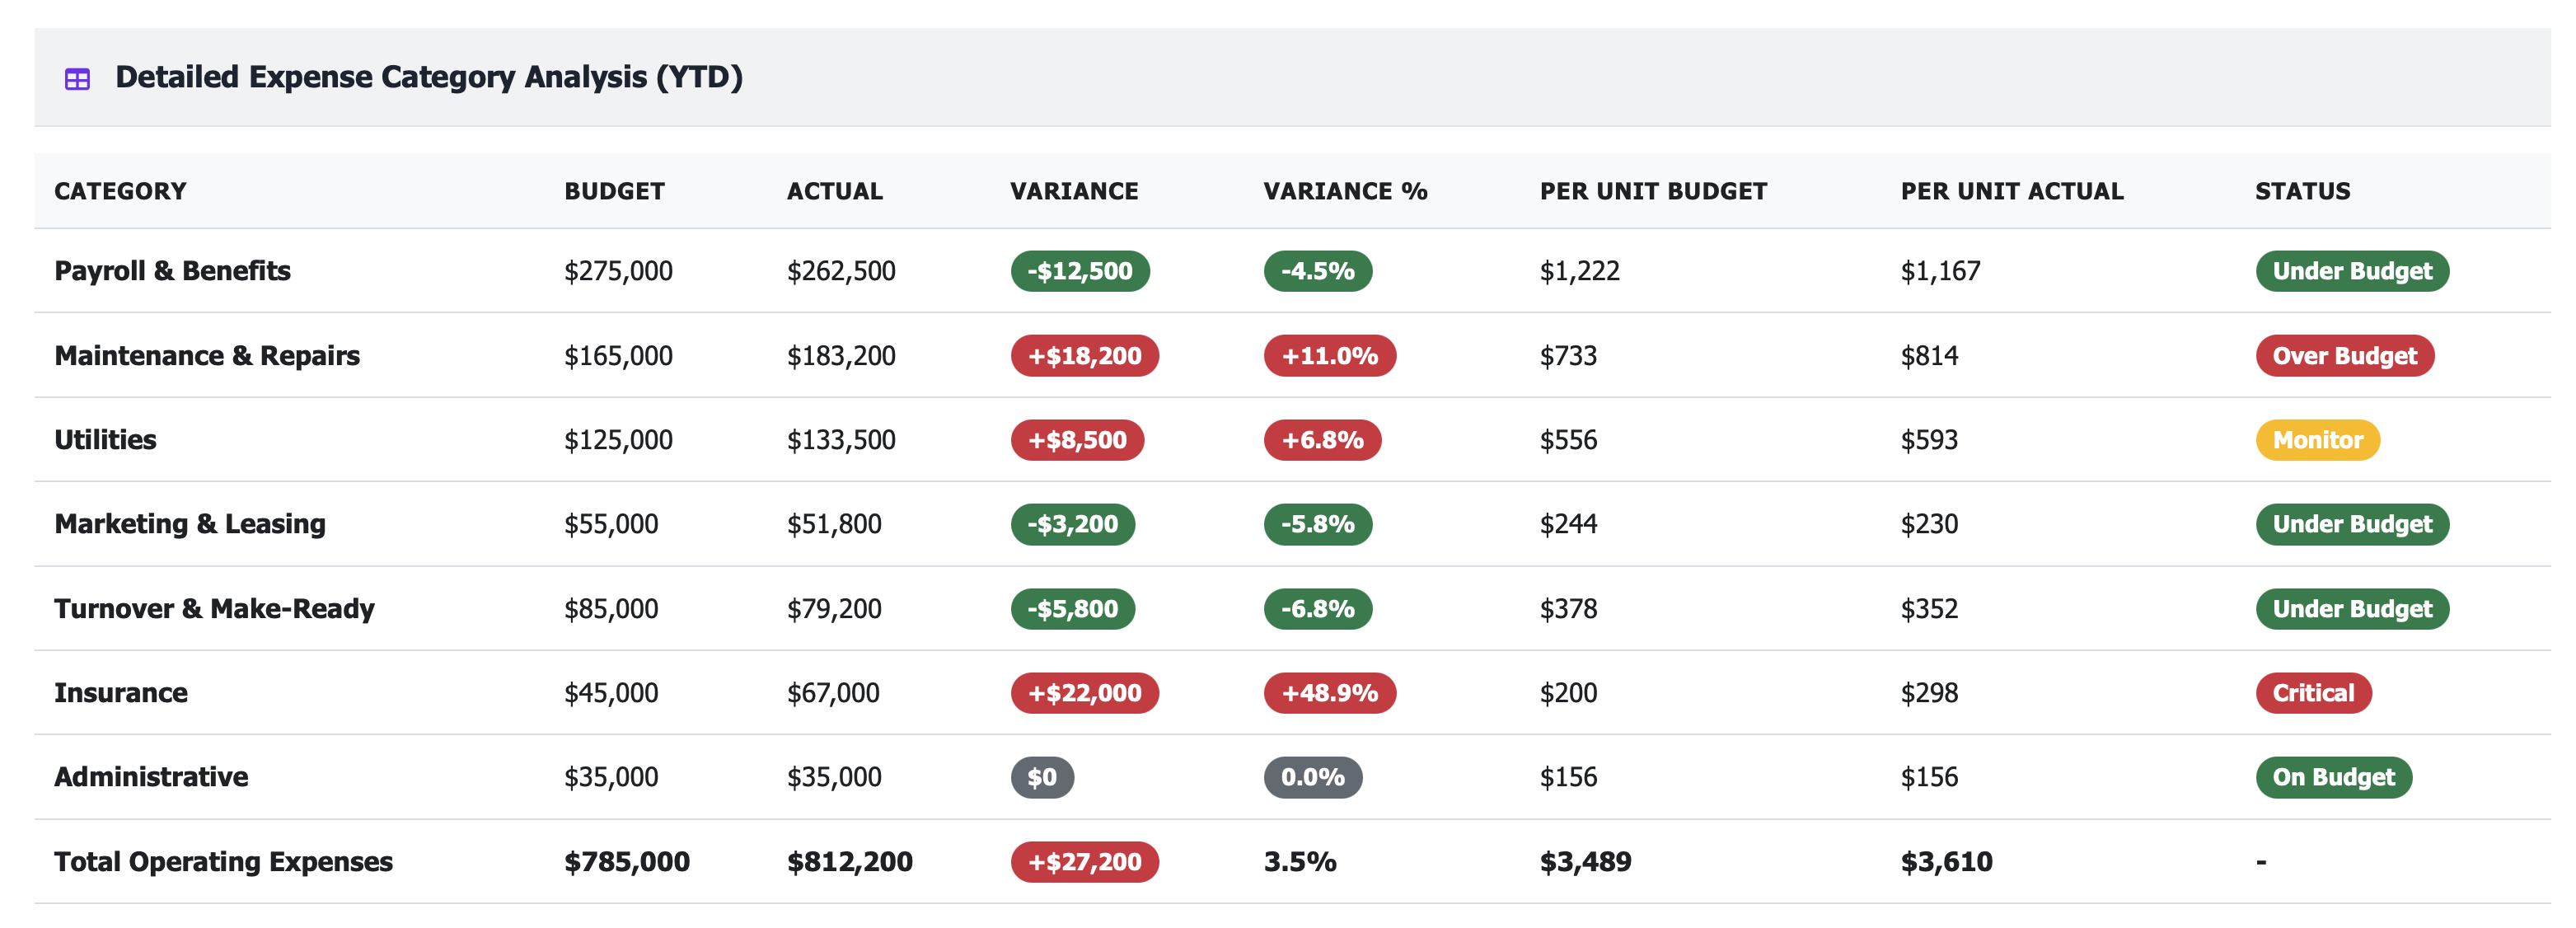
🎯 Category-Level Detail
Drill into every expense category:
Payroll & Benefits
Maintenance & Repairs
Utilities (electric, water, gas)
Marketing & Leasing
Turnover & Make-Ready
Insurance
Administrative
Each with budget, actual, variance, and per-unit metrics.
🚨 Variance Alerts
Set custom thresholds for acceptable variance. Get notified when categories exceed tolerance—5% over? 10% over? You decide. Catch problems while you can still fix them.
📅 Month-by-Month Breakdown
See every month’s performance side-by-side. Track cumulative variance as the year progresses. Identify which months blew the budget and why.
🔍 Top Expense Visibility
View the 10 largest individual expenses each month. See exactly what’s driving costs—was it an HVAC replacement? Insurance premium spike? Unplanned turnover?
📉 Cumulative Tracking
Watch year-to-date variance grow (or shrink) as months progress. See the compounding effect of consistent over-spending or the benefit of course corrections.
💡 Per-Unit Normalization
Compare spending across properties of different sizes. \(85K in maintenance sounds bad—but is it \)378/unit (good) or $814/unit (problematic)? Know the truth.
Perfect For
Property Managers
Manage daily operations with complete visibility into expense performance, enabling proactive budget management
Asset Managers
Monitor financial performance across portfolios, identify outlier properties, and make informed capital allocation decisions
CFOs & Controllers
Provide accurate financial reporting to ownership, forecast year-end results, and maintain tight expense control
Use Case: Catching the Insurance Crisis Before It Exploded
Real Customer Story
Challenge: A 225-unit property had been running “pretty close to budget” for years. In October, they discovered they were $42K over budget YTD—mostly in categories they couldn’t easily explain.
Dashboard Revealed:
Insurance expenses: \(67K actual vs \)45K budgeted (+48.9% variance)
Maintenance: \(183K actual vs \)165K budgeted (+11.0% over)
Utilities: Trending 6.8% over budget due to rate increases
Month-by-month view showed May spike ($12K over) that compounded
Three expense categories “looked fine” but were masking two critical overruns
Action Taken:
Insurance: Discovered mid-year premium increase wasn’t reflected in budget. Shopped carriers, found $8K/year savings. Updated budget forecast.
Maintenance: Analyzed top expenses. Found $18K in unplanned HVAC replacements (3 units). Accelerated preventive HVAC program to avoid more emergencies.
Utilities: Documented rate increases, adjusted remaining monthly budgets, negotiated fixed-rate contracts where possible.
May spike investigation: Identified one-time parking lot resurfacing that wasn’t budgeted. Moved to capital budget.
Forecast adjustment: Revised Q4 budget based on actual run-rates, prevented year-end shock.
Results After Implementation:
Identified $42K variance with 8 weeks left in year to respond
Recovered $8K through insurance shopping
Prevented 3+ additional HVAC emergencies through preventive program
Year-end variance: 3.2% (vs 5.4% previous year)
Q4 budget accuracy: 98.5% due to real-time tracking
Owner confidence increased (no more budget surprises)
Total impact: $18K saved + predictable financial management
“We went from explaining why we missed budget to confidently forecasting performance. Total game-changer.” — Regional Property Manager
Key Budget Metrics You’ll Track
Technical Integration (Works With Your Stack)
Frequently Asked Questions
Q: Can I track multiple properties with separate budgets? A: Yes. View each property independently or roll up to portfolio-level. Compare budget performance across properties.
Q: What if my budget changes mid-year? A: Update budgets anytime via Excel upload or manual adjustment. Historical data remains intact for comparison.
Q: Can I create custom expense categories? A: Absolutely. Map your chart of accounts to our categories or create custom categories that match your business.
Q: How often does expense data update? A: Real-time for supported systems, or daily batch updates. You control the sync frequency.
Q: Can I export reports for ownership/investors? A: Yes. One-click exports to PDF, Excel, or PowerPoint. Schedule automated monthly variance reports.
Q: Does this replace my accounting system? A: No. Your team still uses their existing tools. The dashboard aggregates and visualizes that data for better decision-making.
Q: Can I see variance at the line-item level? A: Yes. Drill into any category to see individual transactions, vendors, or GL accounts driving the variance.
Stop Managing in the Rear-View Mirror
Every day without budget intelligence means:
Expense problems growing without your knowledge
Month-end surprises you could have prevented
Owner questions you can’t answer confidently
Year-end forecasts based on hope, not data
Missed opportunities to course-correct
Your best-performing properties have financial visibility, not financial surprises.
The question isn’t whether you need better budget tracking.
The question is: What’s the cost of your next budget surprise?
Live demo in 30 minutes • See your actual data • No commitment required
Related Topics
Ready to Get Started?
Schedule a personalized demo to see this dashboard in action.
Schedule Demo Contact Sales