Predicting Car Prices with Multiple Regression
Overview
The used car market in the US is massive—we're talking over $300 billion. But here's the thing: predicting car prices isn't as straightforward as you might think. There are tons of variables at play, and understanding which ones actually matter can make or break a pricing model.
Details
The used car market in the US is massive—we’re talking over $300 billion. But here’s the thing: predicting car prices isn’t as straightforward as you might think. There are tons of variables at play, and understanding which ones actually matter can make or break a pricing model.
For this project, I dug into a dataset with over 4,000 vehicles to figure out what really drives car prices. Spoiler alert: it’s not just about the brand name on the hood.
The Challenge
When you’re trying to predict car prices, you’ve got a lot of noise in the data. Some variables matter a lot, others barely move the needle. My goal was to build a multiple regression model that could accurately predict prices based on the features that actually count.
What I Did
I worked with data spanning five key variables: brand, mileage, engine volume, year, and price. After cleaning the data and handling missing values (less than 5% of the dataset), I started exploring relationships. Here’s what I discovered:
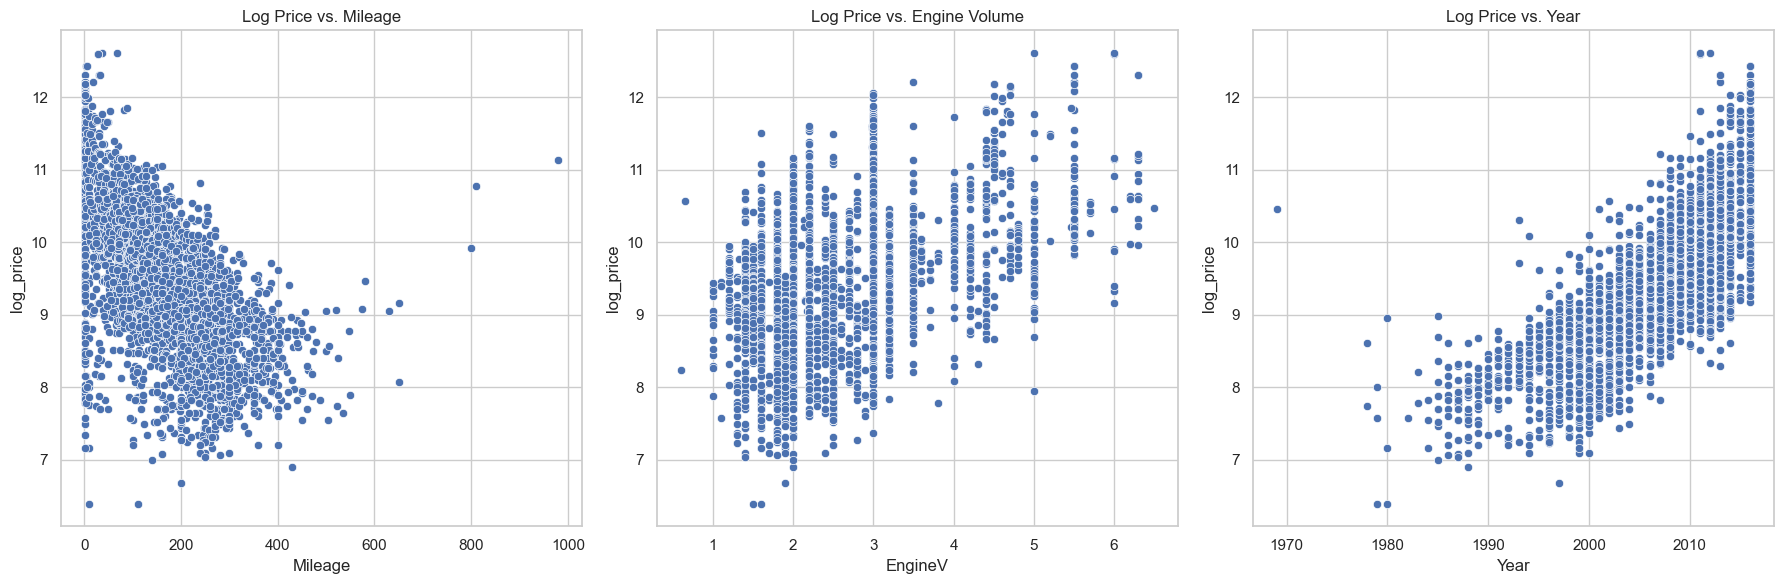
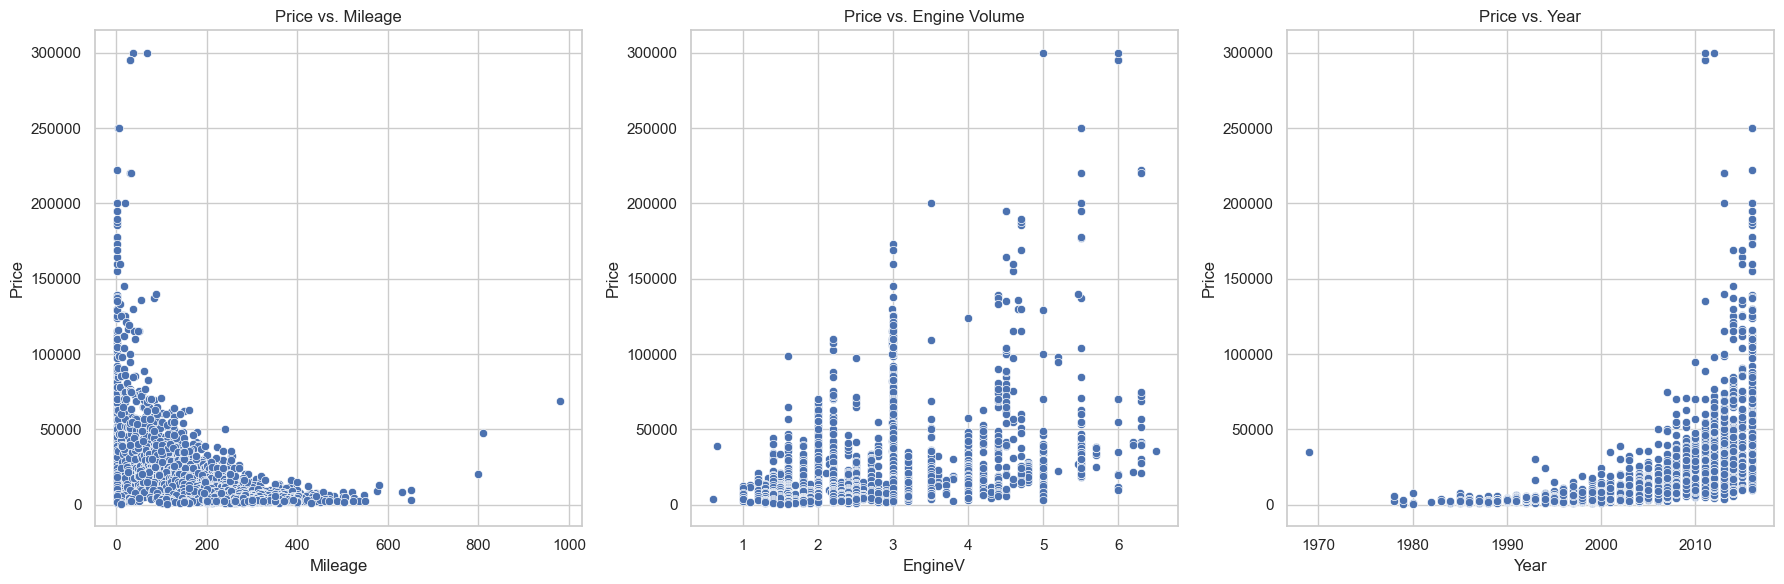
Mileage matters—a lot. The more miles on a car, the lower the price. This showed up as a strong negative correlation in the data.
Year is huge. Newer cars command higher prices, which makes sense but needed to be quantified.
Engine volume? Not as important as you’d think. It had some effect, but nowhere near as strong as mileage or year.
Brand premium is real. BMW and Mercedes models commanded significantly higher prices, while Renault and Mitsubishi vehicles were on the lower end.
One interesting twist: I applied a log transformation to the price data. This helped normalize the distribution and gave me much clearer, more linear relationships to work with.
The Results
My final model explained 80.2% of the price variability—pretty solid for a regression model. All the predictors were statistically significant, meaning they actually contributed meaningful information to the predictions. Here’s the breakdown of what influenced prices the most:
Year of production: Newer = pricier (coefficient: 0.0945) Mileage: More miles = lower price (coefficient: -0.1073) Engine volume: Bigger engines = higher price (coefficient: 0.3209) Brand premium: BMW (+24.97%), Mercedes (+23.89%), while Renault took a hit (-36.95%)
Why This Matters
This type of analysis isn’t just academic—it’s practical. Dealerships, car buyers, and even insurance companies need accurate pricing models. By understanding which features drive value, you can make smarter decisions whether you’re buying, selling, or just trying to understand the market.
The beauty of multiple regression is that it’s straightforward but powerful. No black-box machine learning algorithms here—just solid statistical analysis that tells a clear story about what makes a car valuable.
Details can be found in my GitHub page.