Chicago Crime Rate
Overview
This project explores crime patterns in the city of Chicago using publicly available datasets. The goal is to identify temporal and spatial trends in criminal activity and uncover insights that could help inform public policy, law enforcement strategies, or community safety initiatives.
Details
Chicago has consistently ranked among America’s cities with the highest crime rates. Most crime infested cities have many similarities. For instance, for many years, the city where I grew up, violent crime was confined to certain areas and subdistricts.
As part of my graduate research at National University, I used advanced analytics and machine learning to uncover patterns in over 450,000 crime incidents across Chicago’s 77 community areas.
The Approach
Data Sources & Preparation
I worked with three comprehensive datasets from the Chicago Data Portal:
Crime incidents from 2008-2012: 453,906 arrest records from the CLEAR system
Community hardship index: Socioeconomic indicators for all 77 neighborhoods
Geographic boundaries: Precise mapping of community areas
After rigorous data cleaning (removing <1% incomplete records), I focused on the top 10 most common crimes leading to arrests, creating a foundation for both spatial and temporal analysis.
Analytical Framework
Temporal Analysis
I segmented each day into four periods (morning, afternoon, evening, night) and analyzed crime frequencies across the week. The goal: identify when crimes are most likely to occur.
Spatial Analysis
Using GeoDataFrames and geospatial operations, I mapped crime density across Chicago’s neighborhoods, overlaying socioeconomic data to understand the relationship between hardship and criminal activity.
Machine Learning Models
I implemented and compared multiple approaches:
Decision Tree Regressor for geographic prediction (latitude/longitude)
Random Forest for classification
Decision Tree Classifier for category prediction
Each model was evaluated using standard metrics (MAE, RMSE, precision, recall) with an 80/20 train-test split.
Key Findings
Temporal Patterns Reveal Strategic Opportunities
Narcotics offenses dominate arrests, followed closely by battery charges. But here’s what matters for resource allocation:
Wednesday is peak crime day, with Friday and Tuesday close behind
Sunday shows significant decline—a cyclical pattern law enforcement can leverage
Evening hours see increased battery incidents, suggesting targeted patrol timing
These patterns provide a data-driven roadmap for optimizing patrol schedules and community interventions.
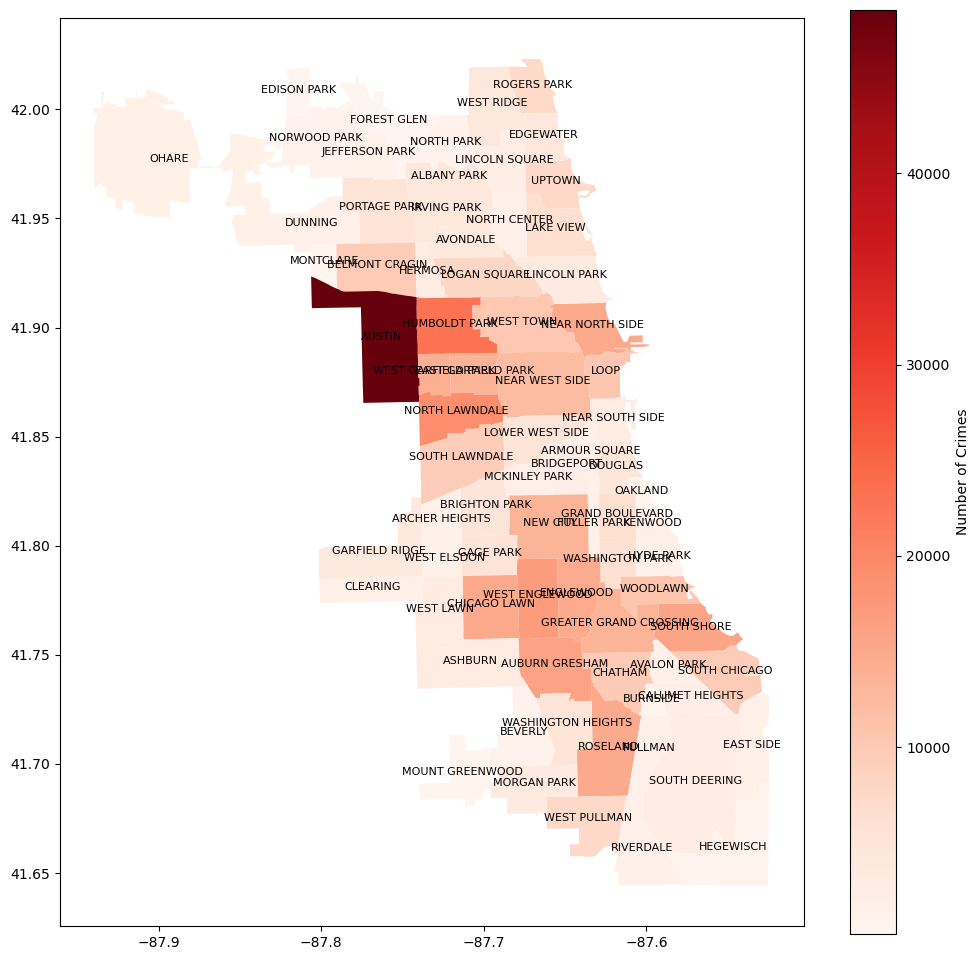
Geography Tells a Complex Story
The spatial analysis challenged simplistic assumptions:
The Austin community area emerged as a clear hotspot with significantly elevated crime counts. However, the choropleth mapping revealed that crime doesn’t respect socioeconomic boundaries as neatly as expected.
The hardship-crime relationship is nuanced: While disadvantaged areas (marked in red on the risk map) show elevated crime, significant criminal activity occurs across neighborhoods with varying hardship indices. This suggests multiple factors at play:
Proximity to transit routes
Commercial area density
Variation in policing strategies
Community resource availability
The scatterplot analysis confirmed this complexity—communities with similar hardship levels exhibited vastly different crime counts, indicating that economic disadvantage is a factor, not the factor.
Model Performance & Insights
The Decision Tree Regressor showed promise in predicting crime locations, though balancing precision and recall across all crime categories proved challenging. This complexity underscores an important reality: urban crime is a multifaceted phenomenon that resists simple algorithmic solutions.
The value isn’t just in prediction accuracy—it’s in the patterns revealed and the questions raised for further investigation.
Business Impact & Applications
This analysis demonstrates how predictive analytics can transform public safety operations:
Immediate Tactical Value
Optimize patrol routes based on day-of-week and time-of-day patterns
Pre-position resources in predicted hotspots during high-risk periods
Reduce response times through strategic geographical allocation
Strategic Policy Insights
Challenge oversimplified narratives about crime and poverty
Identify communities where interventions could have outsized impact
Guide resource allocation beyond traditional socioeconomic indicators
Scalable Methodology The framework developed here applies to any municipality with crime data, offering a template for evidence-based policing and community development.
Technical Highlights
Tools & Technologies
Python (Pandas, GeoPandas, Scikit-learn)
Spatial analysis & geospatial operations
Decision Trees, Random Forests
Data visualization (Matplotlib, choropleth mapping, heatmaps)
Statistical Rigor
Handled 450K+ records with robust cleaning procedures
Cross-validated multiple model architectures
Evaluated using multiple performance metrics (MAE, RMSE, F1)
Data Storytelling Translated complex geospatial and temporal patterns into clear, actionable insights for non-technical stakeholders including policymakers, law enforcement leadership, and city planners.
The Bigger Picture
This project exemplifies the power of data science in the public sector. By combining spatial analysis, temporal pattern recognition, and machine learning, we can move beyond reactive policing to proactive, evidence-based public safety strategies.
The insights don’t just predict where crime might occur—they illuminate why it occurs where it does, opening pathways for interventions that address root causes rather than symptoms.
As cities worldwide grapple with public safety challenges, approaches like this demonstrate that the answer isn’t just more resources—it’s smarter resources, deployed with the precision that only data analytics can provide.
Technologies Used: Python, Pandas, GeoPandas, Scikit-learn, Matplotlib, Decision Trees, Random Forest, Spatial Analysis
Full Academic Paper: Available upon request