
What is Prediction Error?
No model hits the nail on the head all the time.
It is just not possible. It can predict something with a certain level of confidence. It is better than perception. At any point, the predictions could be wrong.
To determine the validity of our prediction, we have something called Prediction Error, and it is used in just about every single model.
What is Prediction Error?
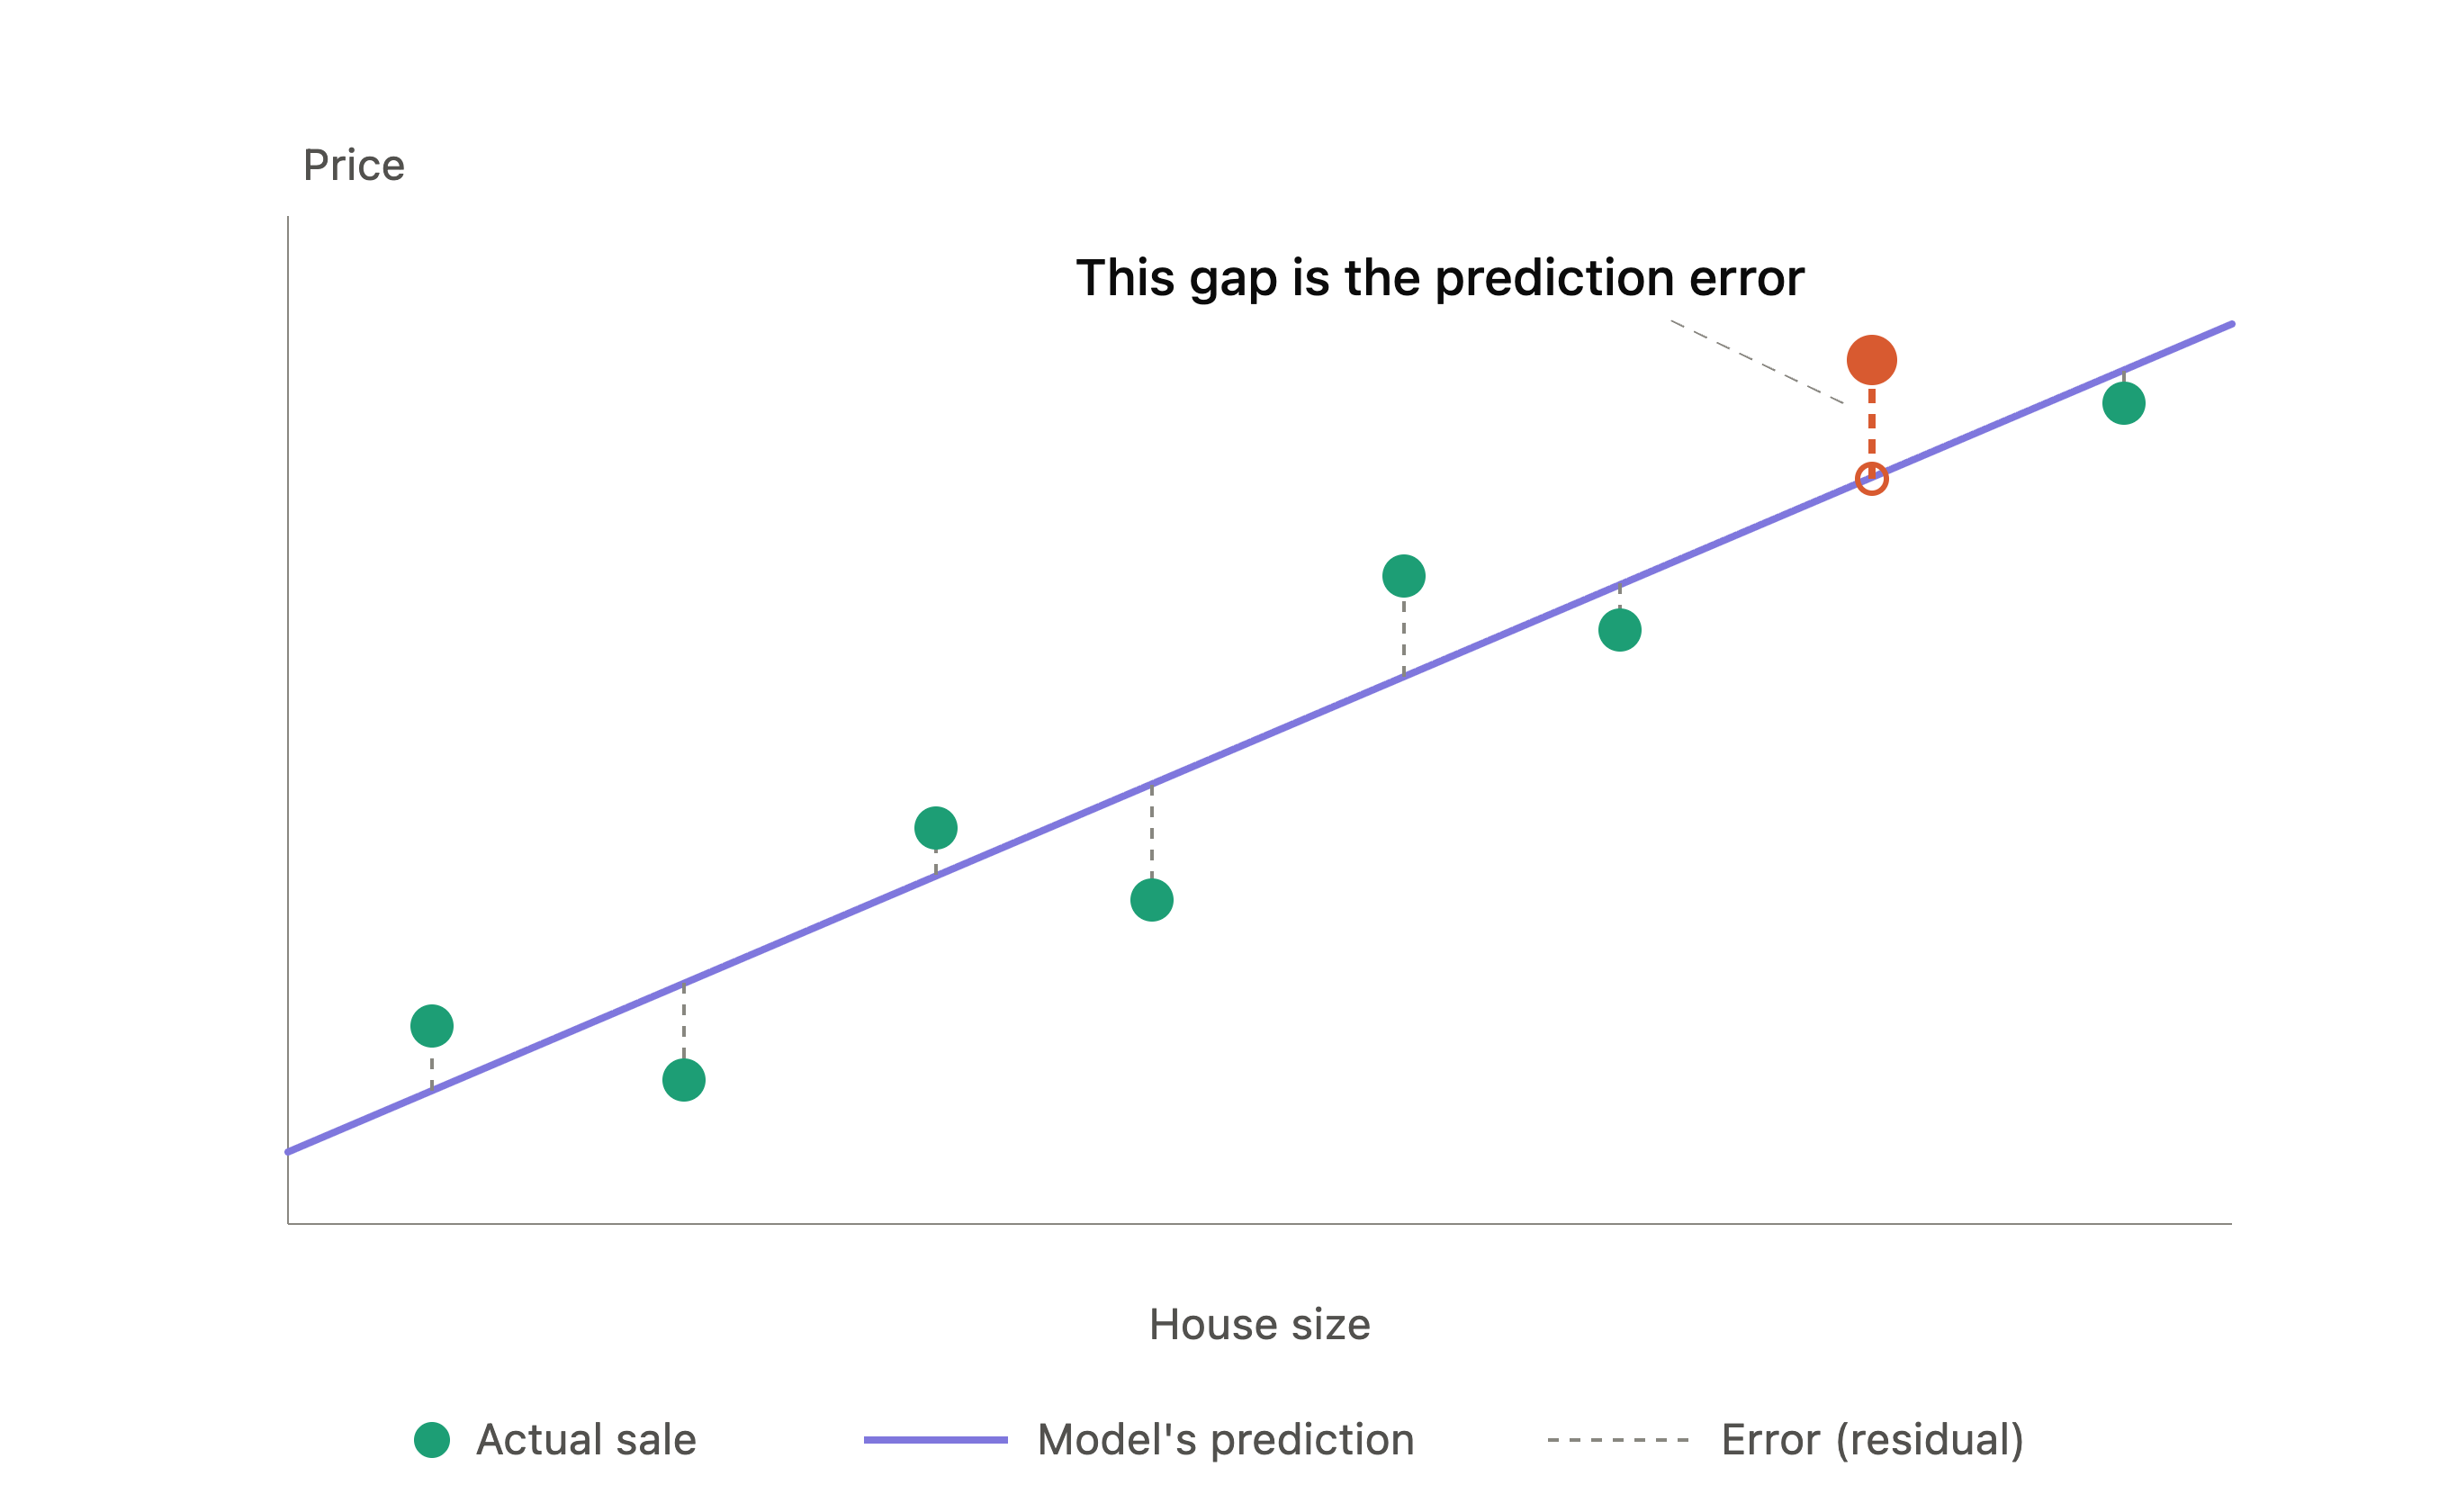
In a machine learning algorithm built to predict something, you will have the prediction and the reality. Prediction error is the difference between the two.
It is like the model’s report card. It tells us how fit and reliable is the model.
Let’s say that we are trying to predict house pricing. We recorded the size and sale price and fit it into a regression. Suppose a 2,000 sq.ft. house sold for $420,000. But our model predicted the same house should have sold for $380,000. The model missed it by $40,000
That small gap, the $40,000 is the error.
A prediction error will help us determine how often the model makes mistakes.
What does the 40,000 mean?
Our model is not bad. The $40,000 implies that something in this particular house was not captured by the model. It could mean the neighborhood or renovated kitchen. The regression model knows none of that.
This represents the variation in the outcome for what the model didn’t account for. It is helpful information.
What the Model Doesn’t Understand
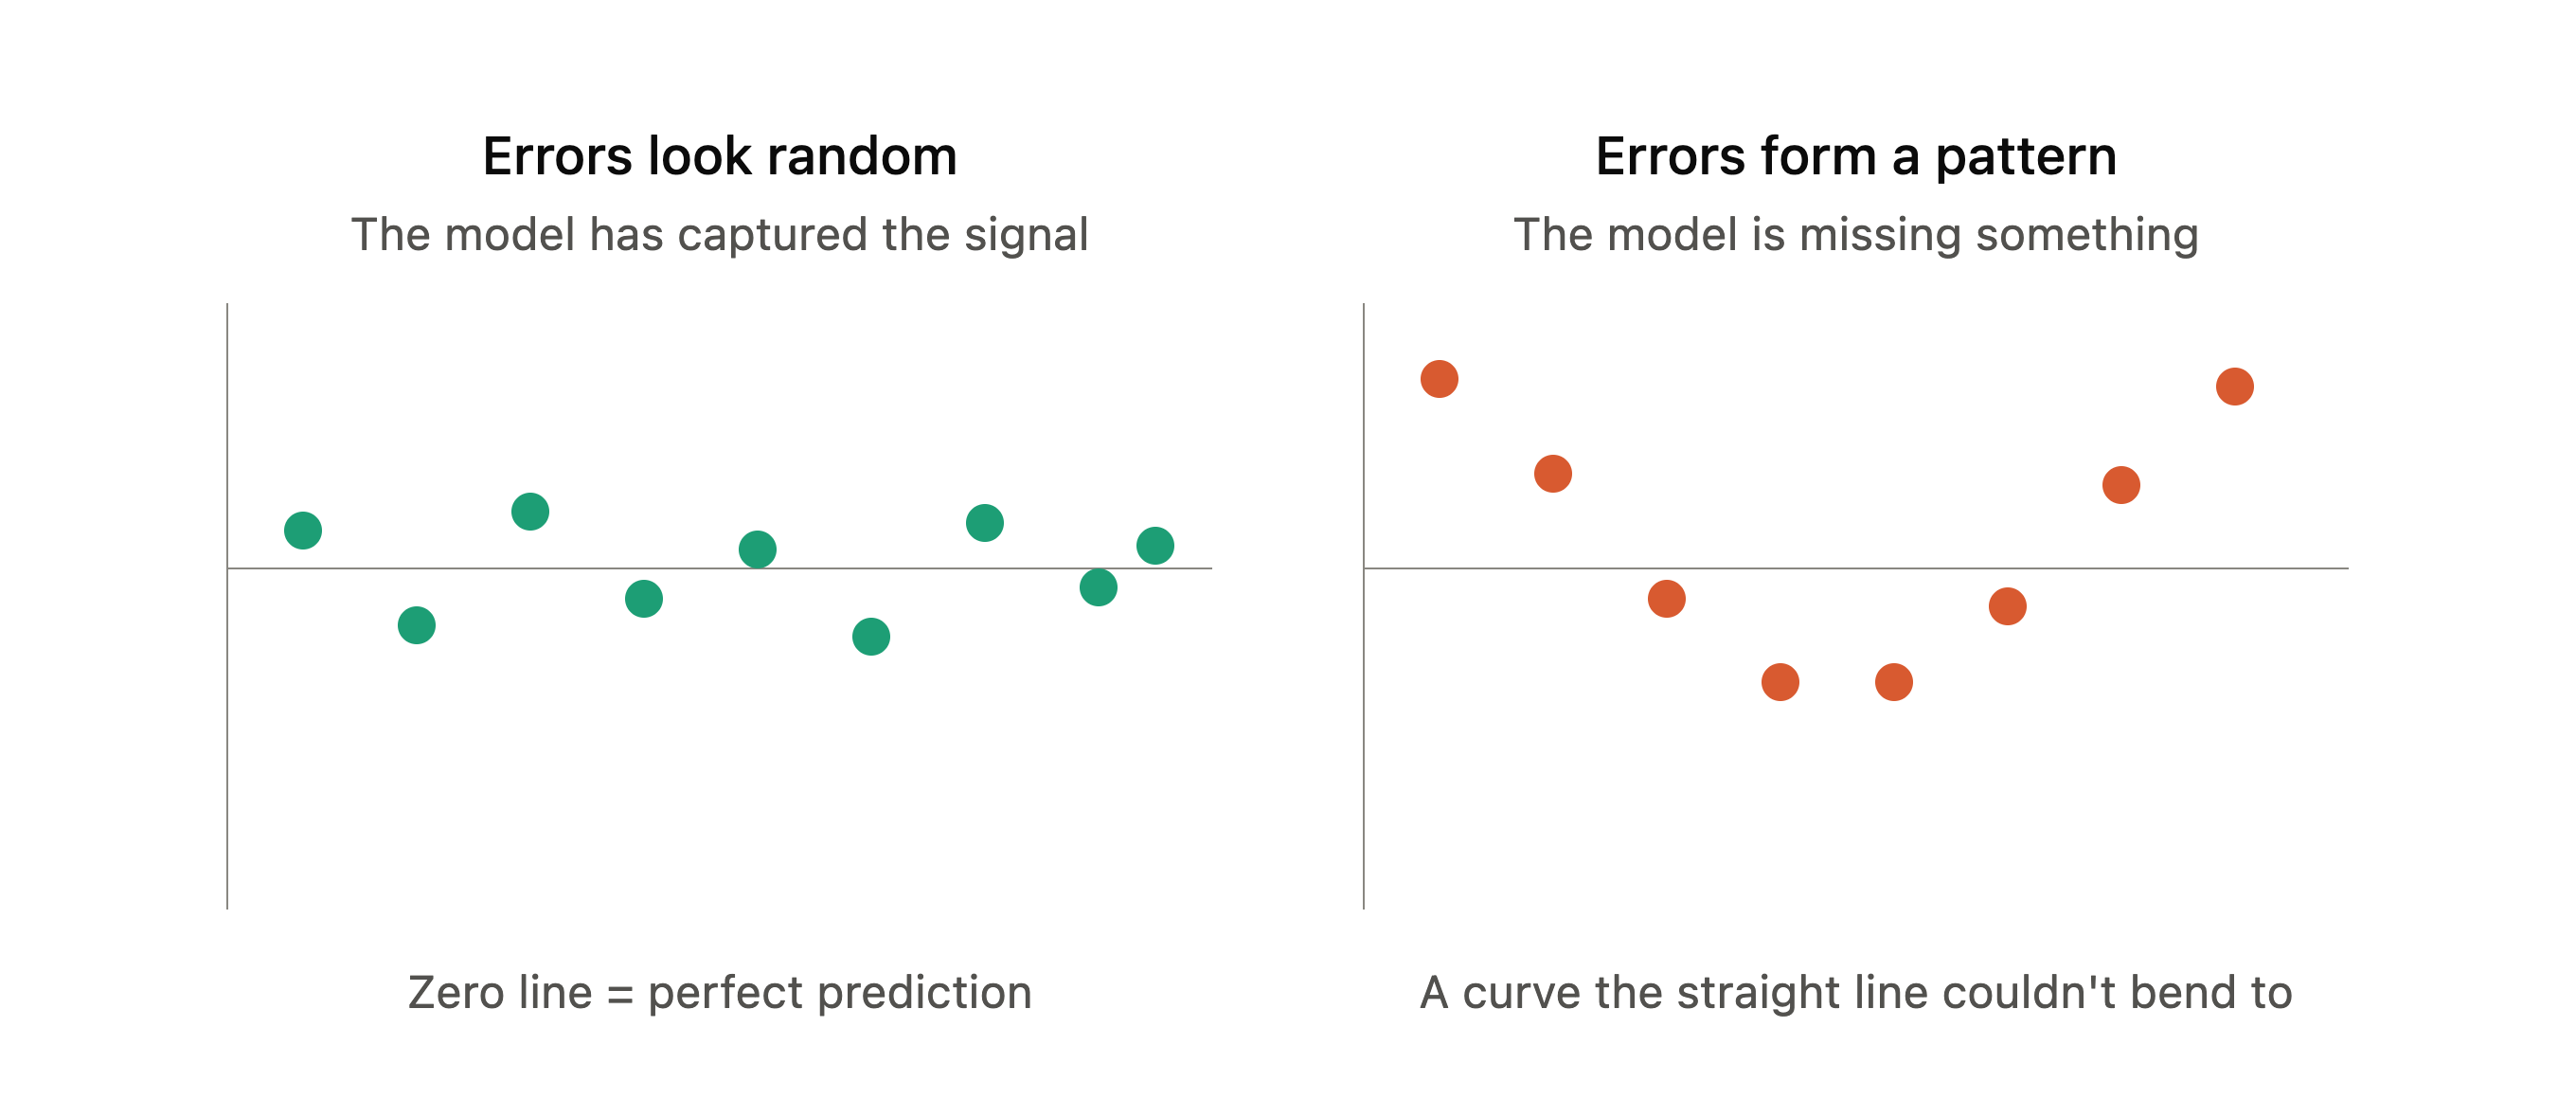
Prediction error can also tell you what your model is not understanding.
On the left, the errors are noise. A linear relationship assumes that the outcome changes at relatively constant rate as the other variables.
Using the same house example, if every additional 500 sq.ft. tends to add roughly the same amount of home value, a straight line reasonably provides a relationship summary. The line captures the general direction and rate of the change.
In practical terms, a linear model is saying, “For every additional unit of X, I expect Y to change by approximately this much.” The strength of linear regression is its simplicity: the relationship is easy to calculate, visualize, explain, and use for prediction.
On the right side, the curved, nonlinear, relationship appears when the effect of X on Y changes as X changes.
Consider age and healthcare costs. Costs might remain relatively stable through early adulthood, rise gradually during middle age, and then increase much more rapidly later in life. A straight line would struggle to represent that behavior because it assumes the same rate of change everywhere.
Why Prediction Error is Important
Let’s use a video game and sports analogy here.
When playing my soccer video game, I’m often faced with difficult decisions when selecting my strikers. My players overall rating for those positions vary from 85 to 92. Some are faster, other are taller with better heading skills, others are better for set piece, or dribbling. My final decision will depend on my adversary and my strategy.
If the adversary has tall center backs, my areal game will be handcapped. I need a better passer and dribbler. Or the guy who is good with set pieces. The decision will vary drastically.
Prediction error is similar. Except you want it a low number rather than large.
The overall rating tells you roughly how good a player is; individual attributes tell you when he’s good. Prediction error works the same way: the headline number ranks your models, and the break down of the error tells you which one to start against the opponent.
No comments yet. Be the first.