How Can Data Help Save Cracker Barrel?
When I moved to America in the Spring of 2002, the very first sit-down restaurant I visited was Cracker Barrel. The food was fantastic. But it was the experience that was remarkable.
That night, when the manager heard it was my first time, he brought me a Baked Apple Dumplin’ on the house. It was one of the best experiences I had.
To put this into perspective, I grew up in one of the largest cities in the world and frequented a multitude of restaurants—from humble holes-in-the-wall to upscale eateries. Yet, I had never seen anything as unique as Cracker Barrel. The homey country feeling had a vibe that connected with me.
For many years, the Old Country Store has been a part of many of my celebrations—undergraduate graduation, engagement, birthdays, childbirth, among others. But that changed in recent years.
After the pandemic, I have been to the restaurant a total of five times. Not because I dislike the food. But the service has been disappointing. For the purposes of this post, I don’t want to get entangled with my personal experiences. Instead, I want to focus on how data could potentially solve many of the issues Old Country Store is facing today.
The New Image Affair
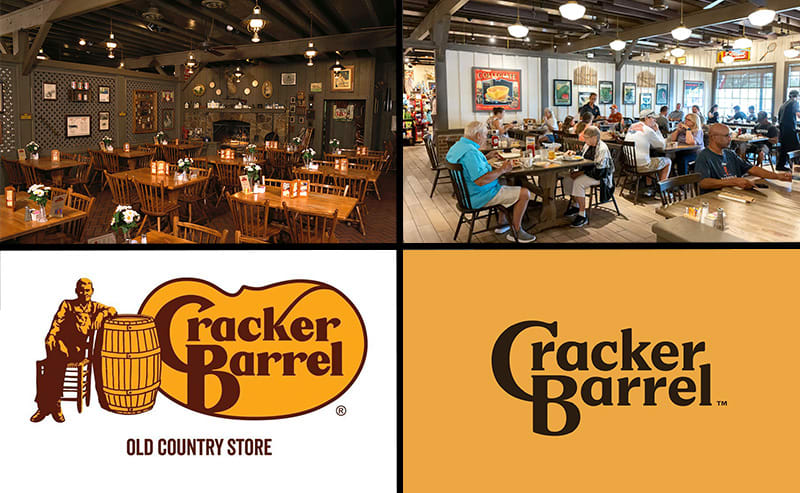
Source: AY Magazine
This post has been long coming. Since the announcement of the new logo and store remodeling on August 19th, I have been keeping a finger on the pulse. My immediate knee-jerk reaction was: this was not a good idea.
Within hours of the announcement, social media exploded. Judging by everything I was seeing on the internet, there was little doubt that the decision was a mistake.
But my judgment was put to the test when two days later, Julie Felss Masino, the CEO, appeared on live television to report that the feedback on the changes had been “overwhelmingly positive.” I was confused.
Her statement was so controversial to what I was seeing that I wondered if there was something wrong with my social media and news algorithms. I found comfort in the thought that a company of this caliber wouldn’t make a $700 million decision on a whim.
Surely, before rolling out a huge change nationwide, they went through some process. There must have been some kind of focus groups, sentiment analysis, market research, A/B testing, surveys, sitting down with middle management, right?
Right...?
A week later, all the changes were off the table. What I came to call the “new image affair” cost the company $100 million.
Cracker Barrel still faces a significant problem to solve: how to fix its shrinking profit margins.
Let me be upfront, I do not have any experience in the restaurant industry. None. I have never been in the industry in any capacity, not even as a server. But business is business. And I do know how to apply data in business applications. Multiple studies indicate that data-driven decisions can improve a business’s bottom line.
With that said, data can help the Old Country Store to weather this storm and become a thriving business once again. If I was hired by Cracker Barrel, this is what I would do.
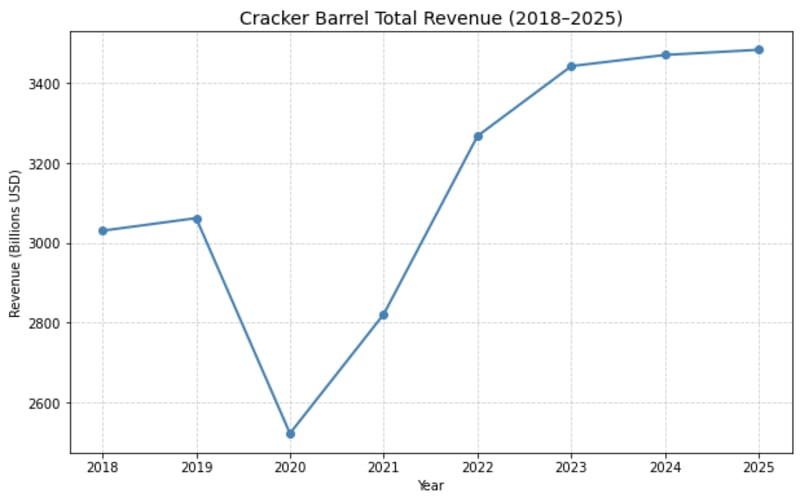
The Numbers
Before diving into the many possibilities to turn things around, I wanted to look at the restaurant’s current numbers. I went through all of their quarterly reports and collected some information. I am making it available in my personal GitHub.
If we look at sales strictly, you might think they are not doing so bad. The sales have consistently increased since 2020.
However, when you add other elements into the report, a stark picture emerges.

You can see that the operating margin is consistently decreasing, and the net margin is also decreasing at a fast rate.
The company now knows the solution is not remodeling stores and changing menu items. Those items can be removed from the table.
The solution, in my opinion, lies within the vast amounts of data they collect daily.
From a data standpoint, here is my blueprint.
Step 1: Stop the Bleeding
The first step of this magnificent plan is to figure out how to stop the bleeding. To accomplish that, we can use data to determine the most problematic stores.
The job of a data scientist is not just finding the stores that are consistently on red. The most crucial part is to pinpoint why they are not generating a profit. This includes examining internal and external factors, such as operational inefficiencies, staffing challenges, pricing strategies, and even macroeconomic shifts that may impact consumer spending.
Suppose there is a store in a city where unemployment is very high, and the largest employer announced more layoffs. It doesn’t matter how good the manager is; that restaurant is doomed.
The final report in this step should be two parts. The first step is to present all the locations that are irreversible and those that are salvageable. The second part would be a deep dive into each location labeled “recoverable.”
These should be treated individually, pinpointing specific challenges and determining the cause of the loss. Remember, this is from a data standpoint, and I’m just presenting the facts. It is not up to me to create a strategy.
Step 2: Sentiment Analysis
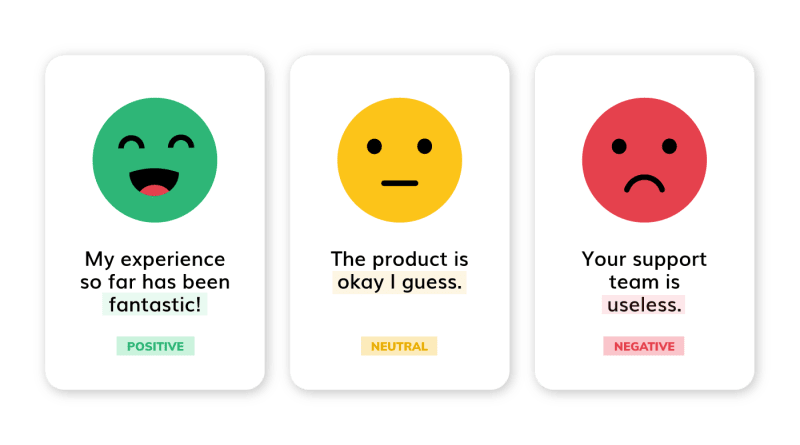
The last few times I dined in, my experience was less than pleasant. The food was great, but the service fell short of expectations. It made me wonder if this is a common trend.
In the process of writing this, I began to look around at some of the store reviews on Google and Yelp. That’s when I realized that I was not unlucky; the service I had received was not an isolated event. Several patrons shared the same frustrations.
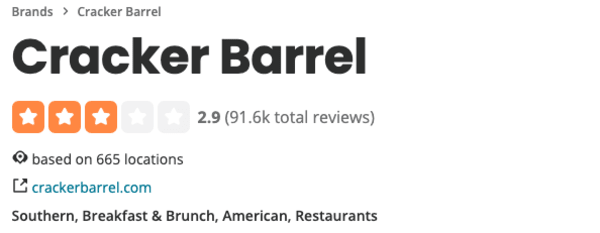
One quick look at Yelp revealed that customers have not had a good experience. Sitting at a 2.9 with nearly 100k reviews, it indicates the problem is much bigger than the looks and logo.
This is a layered problem, and we have to tackle one issue at a time. In this analysis, I would not consider wait times a negative aspect. Not right now, anyway. Instead, I would focus mostly on customer service and store issues—such as cleanliness, food quality, and staff friendliness.
This highlights the reason why customers are dissatisfied with their service. Get enough of those, and it could be the cause of non-returning customers.
Before we proceed to the next step, I would like to highlight something I noticed.
Looking through the comments, I noticed something that struck me as odd. The restaurant’s response to negative feedback was canned and showed no sympathy.
Imagine this: an irate customer spends 30 minutes of their precious time writing in detail about their bad experience at Cracker Barrel. Three paragraphs later, they explained everything that went wrong with their visit. Then the restaurant responds to the complaint with this.
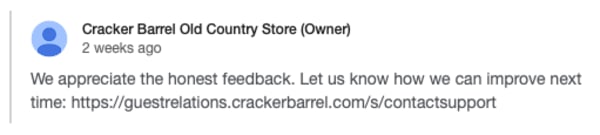
This. Is. Infuriating. What do you think your dissatisfied customer is doing when writing the very detailed review? Taking a break from watching television? No. They are telling you how you can improve next time.
This only tells me that no one is reading the bad reviews. If they do, they don’t care. They are just pasting the same sentence over and over.
Perhaps the first step is to train those who reply to comments to be more empathetic and provide genuine replies.
Step 3: Demographics

Cracker Barrel is not everyone’s cup of tea. It is essential for the company to identify those who are passionate about their food and stores, and target that specific group of people.
The data they have collected over the years can help them identify their primary customers. By analyzing purchase patterns, location data, average spend, frequency of visits, and peak dining times, we can paint a detailed picture of the customers.
Understanding who is walking through the doors—and who is no longer—is critical.
But demographics alone don’t tell the whole story. We need to understand the why behind the numbers. Why do certain age groups visit more frequently? Why have some demographics dropped off? What are their expectations, and where is the store falling short of them?
This analysis should also identify untapped markets. The demographics that naturally align with Cracker Barrel’s offerings are not being reached.
The goal isn’t chasing trends and abandoning everything else. It’s to double down on serving people who already love the brand, and reach the skeptical ones.
Step 4: Competitive Benchmarking

Cracker Barrel doesn’t operate in a vacuum. To understand where the company stands, we need to analyze the competition. This is to identify gaps and opportunities.
This involves collecting data on similar chains, including Bob Evans, IHOP, Denny’s, Waffle House, and regional competitors. We are looking at pricing strategies, menu offerings, customer satisfaction scores, wait times, loyalty programs, and digital presence.
The analysis should also include the market share trend to help determine if competitors are gaining ground in areas where Cracker Barrel is losing.
Benchmarking is not only about competitors. Another critical element in this process is determining what customers are expecting in today’s environment—mobile ordering, delivery options, healthier menu alternatives, and faster table turnover, among others. More specifically, the demographics the restaurant is targeting.
This data will reveal where The Old Country Store is falling behind industry standards and where it still holds a competitive advantage. The goal is to clearly understand the competitive landscape and create a framework that enables them to win.
Step 5: Control Group
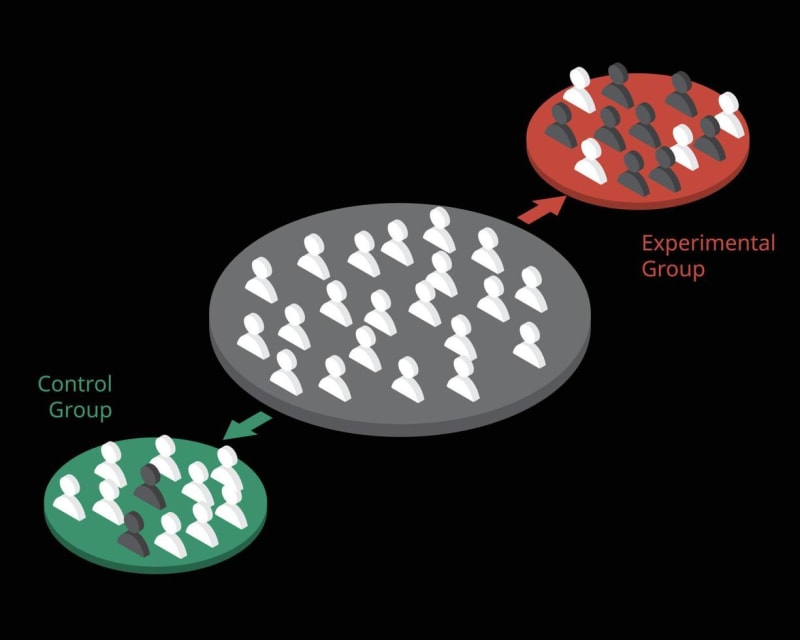
Obviously, not all stores are struggling. At least, I hope that’s the case.
As part of my data plan, I would identify the top-performing and treat them as a control group for success. This involves analyzing every aspect of what makes these stores profitable, including operational procedures, staffing models, management styles, inventory practices, customer service protocols, the overall location (near an interstate or embedded in the city), and even local community engagement.
The goal is to find patterns and similarities between the stores and replicate them in the failing ones. The data could reveal that the control group has longer-tenured managers or a similar staff-to-customer ratio.
Once those commonalities are identified, we can create a “playbook” of best practices. Note that we can’t assume these strategies will work everywhere. A practice that works in a thriving suburban location might not translate to a rural highway stop.
This is where data becomes invaluable. We match underperforming stores with their most similar high-performing counterparts. Then we pilot the successful store’s strategies at the struggling one, measuring results carefully.
Step 6: Marketing Effective Analysis

Two critical questions need to be answered: where is the marketing budget going, and is it working?
Every marketing channel the company is using—social media campaigns, email marketing, traditional methods, partnership deals, and so on—needs to be analyzed. For each channel, key metrics must be tracked and monitored. This will help determine customer acquisition cost, conversion rates, return on ad spend, and whether these campaigns are driving foot traffic or just brand awareness.
The data can reveal surprising insights. Perhaps that expensive TV commercial during prime time isn’t bringing customers through the door, while a modest Facebook ad targeting families is outperforming everything else.
Every dollar spent on marketing should be scrutinized. For instance, is the marketing money being spent in areas that are performing well, while neglecting those that are struggling? Are the same generic campaigns being run nationwide instead of tailoring the message to local markets?
Similarly, social media engagement deserves special attention. Analyzing customer engagement can be a step in itself. I will reserve this for phase 2, when the company is generating large profits as it once did.
Step 7: Employee Satisfaction & Retention

Before I proceed to this step, I would like to note that personnel analysis is highly regulated. And for a company that has been embroiled in multiple lawsuits on this subject, this might be a topic they want to leave alone.
Fear not, this is not a risky analysis, and it would be conducted ethically and in compliance with all applicable laws and regulations. Much like other steps in this project, this approach would be multi-layered, focusing on three key areas: employee satisfaction, experience mix, and customer-to-server ratio.
Let’s start with employee satisfaction. Each employee would be given a survey with several questions about their feelings regarding their job, the store, and the company. This provides a clear breakdown of how the employee feels about the corporate environment and their store.
Additionally, surveying employees can reveal a great deal about management and other intricacies that would otherwise be missed.
Using the control group, we would determine the optimal customer-to-server ratio and the ideal experience mix. For instance, during a busy shift, the restaurant must have 10 servers: two 5-star, two 4-star, three 3-star, and the remaining could be one-star or rising-star.
Step 8: Operational Efficiency Analysis

In the reports I quickly analyzed, it is clear that sales are increasing, but profit margins are shrinking. Over the last five years, the landscape has changed, and employees are now significantly more expensive than they used to be.
However, it would be foolish not to examine each restaurant’s day-to-day operations.
Start with the kitchen: analyze prep times, order accuracy rates, and food waste. We can then compare our results with those of the control group. Every operational aspect needs to be scrutinized, including waste, over-ordering, poor portion control, and food spoilage. Every wasted ingredient is money thrown away.
Then examine front-of-house operations: table turnover rates, average wait times from seating to service, payment processing speed, and staffing patterns. Are tables sitting empty while customers wait? Are servers stretched too thin during rush hours? Is there a mismatch between staffing levels and actual customer volume?
Supply chain deserves scrutiny too. Are food costs rising faster than menu prices can keep up? Are certain locations paying more for the same ingredients due to inefficient ordering or supplier contracts? Can bulk purchasing or renegotiated contracts improve margins?
Labor costs are another critical piece. Analyze scheduling efficiency—are stores overstaffed during slow periods and understaffed during busy ones? Is overtime being used excessively to compensate for poor scheduling? Are training programs effective, or are new hires taking too long to become productive?
The data should pinpoint exactly where money is leaking. Maybe it’s inefficient scheduling. Maybe it’s the equipment that needs upgrading. Perhaps it’s due to inconsistent processes across locations. Whatever it is, operations is where profit margins live or die.
Step 9: Loyalty Program Analysis
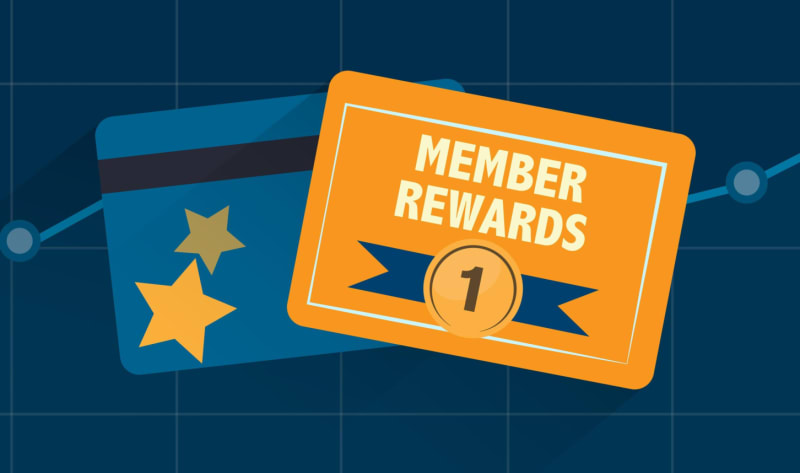
Loyalty programs are goldmines of behavioral data, yet many companies fail to extract their full value. We need to analyze it thoroughly. If they don’t, that’s a critical gap that needs to be addressed.
The data from a loyalty program reveals patterns that anonymous transactions never could. We can track individual customer frequency, spending habits, favorite menu items, preferred locations, time of visit, and seasonal trends. This information shows us who the most valuable customers are and what keeps them coming back.
We need to segment loyalty members into tiers based on engagement and spending. The top tier—frequent visitors who spend consistently—deserve special attention and targeted rewards. But equally important are the lapsed members, those who joined with enthusiasm but haven’t returned in months. The data can tell us when they dropped off and what might bring them back.
The program’s structure itself needs evaluation. Are the rewards compelling enough to drive repeat visits? Is earning points too slow, causing members to lose interest? Are redemption options valuable, or do customers accumulate points they never use? A loyalty program that doesn’t drive behavior change is just an expensive database.
Integration with other data sources amplifies the value. Combining loyalty data with sentiment analysis, demographics, and operational metrics creates a complete picture of the customer journey. We can see not just who visits, but why they visit, what they experience, and whether they’re satisfied enough to return.
This isn’t just about rewarding customers. It’s about understanding them deeply enough to serve them better.
Conclusion
The steps laid out above are just the beginning. Analyzing this data could provide Cracker Barrel with insights that, when properly executed, can keep its doors open.
The moral of the story is: Cracker Barrel doesn’t need a new logo or modern looking restaurants. It needs to start listening to its data—because the numbers already hold a story of how it can thrive again.
This outline is not the holy grail by any means. Data science is fluid and as the data tells its story, the strategy must be recalibrated to fit the emerging needs.
No comments yet. Be the first.