Central Limit Theorem
The central limit theorem (CLT) is, arguably, the most important theorem in statistics. It is, in many cases, an introductory statistics course.
The central limit theorem (CLT) is, arguably, the most important theorem in statistics. It shows up in just about every introductory statistics course.
It’s true. Just about everything in statistics is based on CLT. Without it, the notion that sample data determines the population’s probability distribution wouldn’t exist.
Think about pharmaceutical trials. After trying the drugs on animals, it moves on to people. They will test random people with the problem they are targeting.
Using relevant variables, they expand it to the population using probability.
It is fully based on CLT. It assumes that the medicine working for a sample will work in the greater population.
Basic Concepts of CLT
CLT is fairly simple. A large enough, randomly selected sample can be used to estimate a population using inferential statistics.
The binomial distribution is a good way to visualize what happens as sample size grows
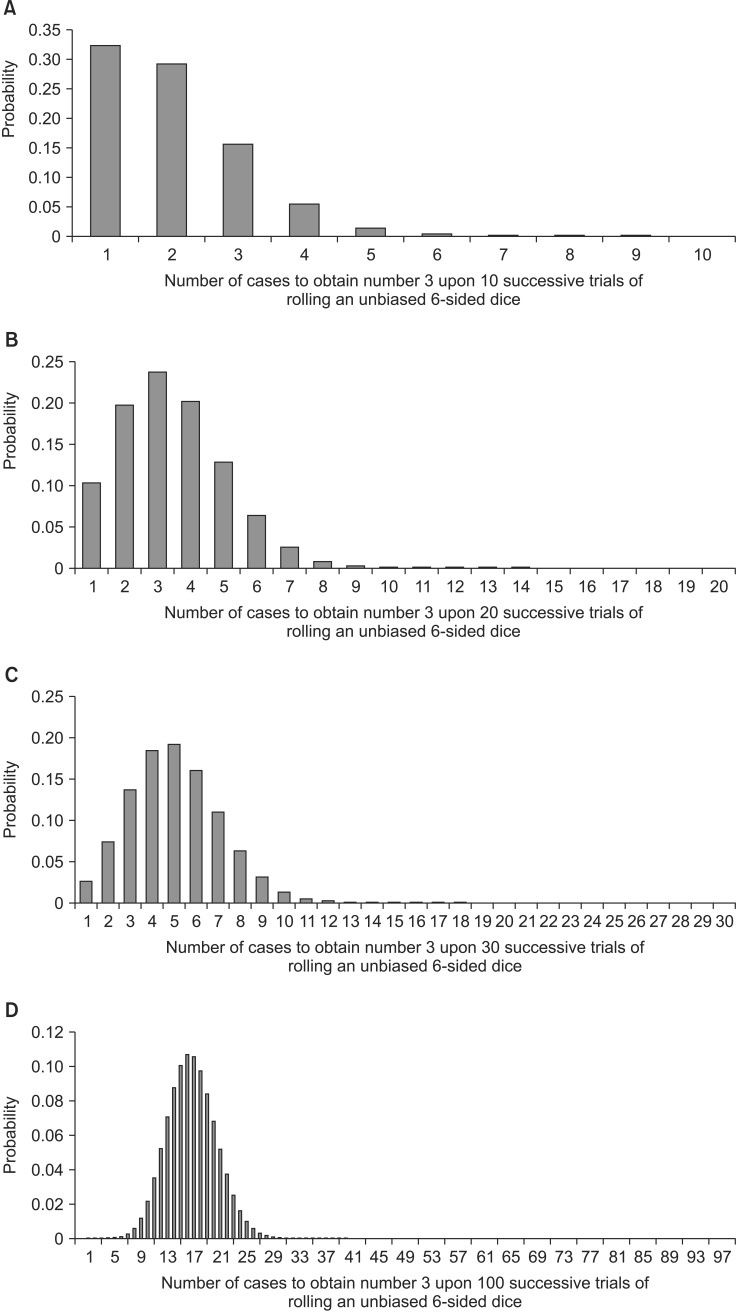
An unbiased 6-sided dice is rolled at \(n\) times. The probability of rolling the number 3 \(x\) times in \(n\) has a binomial distribution.
Kwak and Kim (2017) show it well in the graph below.
On graph A, when \(n = 10\), the probability is skewed-right. When \(n\) is doubled to 20, B, you can see the distribution becoming more symmetric.
Notice that in D, \(n = 100\), the distribution is normal with a nearly perfect bell-shaped curve.
Conclusion
Understanding this concept is critical for future work. Anytime I’m working with a sample, I use this concept to help ensure the data is large enough.
In fact, the reason I revisited this concept was because I was working with an NHANES dataset and trying to determine whether the sample was sufficient to yield the answers I was seeking with the data available.
No comments yet. Be the first.